Substantiation of the optimal performance parameters for a quarry during the stage-wise development of steeply dipping ore deposits
- 1 — Ph.D., Dr.Sci. Professor Empress Catherine II Saint Petersburg Mining University ▪ Orcid
- 2 — Postgraduate Student Empress Catherine II Saint Petersburg Mining University ▪ Orcid

Abstract
The use of stage-wise schemes in the development of deep quarries is one of the ways to increase the economic efficiency of mining a deposit and determining the optimal stage parameters remains an urgent task. Such parameters are stage depth, bench height, block length, etc. However, there is a wide range of values for these parameters. Therefore, to select the optimal values and evaluate the effectiveness of design solutions, it is advisable to use the net present value, which is an international notion. As a result of the analysis of data on deposits, a large number of variable indicators can be identified that presumably affect the efficiency of mining. The article proposes to divide all parameters of the quarry mining into two types: mine engineering and economic. The importance of each of them is determined by the measure of influence on the net present value. Thus, to assess the measure of influence of mining indicators, the average values of each of them are taken, and as a result of the alternating change of one parameter under study, the measure of its influence on the discounted income received is estimated. The results of the analysis of relevant factors, their evaluation and comparative analysis are important indicators that significantly affect the design decisions made and the effectiveness of the investment project.
None
Introduction
In a volatile and dynamically changing market for mineral raw materials, mining enterprises that develop deep, steeply dipping deposits with constant productivity are forced to adapt to increasing requirements. One of the ways to increase the efficiency of mining is stage-wise mining schemes with a temporarily non-working wall [1].
An immense potential in the field of improving existing open pit mining technologies and increasing their economic efficiency lies in the stand-by mode of a part of overburden rocks and creating a temporarily non-working zone within the quarry field, which will reduce the volume of capital mining and the number of overburden operations at initial stages of the quarry.
The design of quarries in stages, each with an intermediate contour, is advisable to minimize economic costs [2]. An important task is to determine the stage parameters [3, 4]. Efficiency of the stage-wise mining method depends on the implementing the mining operation mode, which will ensure the required volume and quality of products while minimizing the level of mining costs [5]. This is primarily due to the fact that the design and process parameters of the quarry and, as a result, the performance indicators of mining as a whole depend on the mining operation mode.
The development of a quarry in stages is characterized by the procedure for conducting mining operations, in which a pillar is formed in the working area, a temporarily non-working wall (TNW), which contributes to a stage-by-stage increase in the volume of stripping operations over time. The formed pillar can be used not only in stage-wise mining schemes, but also within the same operational time period. In this case, during the formation of a temporarily non-working wall, when the working area length is reduced, work is carried out to eliminate the pillar in the upper horizons of the non-working wall [6].
Formulation of the problem
When choosing options for the location of the stage contours in the deposit, one should consider many economic, mining, geological, and mine engineering factors. The use of stage-wise schemes is successfully implemented at large steeply dipping ore deposits: Maly Kuibas, Olenegorsky, Sarbaisky quarries, etc.
The proposed mining method can be used in groups of quarries that develop isolated steeply dipping ore deposits, or in quarries elongated along strike with the division of the working area into two sections.
At each of the allocated sections, in turn mining is proposed. During mining operations at one section, a temporarily non-working wall is removed at the other and the transition to the next stage of mining is implemented. The scheme of the working order is shown in Fig.1.
Mining operations at the deposit begin in the southern section, marked with I. During the first period of operation, all reserves in the Т1 contour are mined. In the next time period T2, mining operations are started in the northern area (II). At the same time, the temporarily non-working wall is removed in the southern section. After the end of period T2, mining resumes in section I, and in section II, work begins to eliminate the pillar, etc. The entire deposit is mined in a similar way.
While the stage mining is underway at one of the sections, at the second section the rock wall moves from the boundaries of the previously mined area to the boundaries of the next stage. During the advancement of the TNW from the current position to the boundaries of the new stage, a section of the working wall with working ramps on each horizon is created in the mining zone. This enables to provide free access to the development of mineral reserves at the next stage [1, 7, 8]. The non-working wall of the quarry at the mining stage should be removed after all reserves in the stage contour are developed. Thus, the TNW slope angle can reach the design slope angle of the quarry wall at the end of its development.
Each new mined stage should have a greater depth than the previous (worked out) one. The fulfilment of this condition will make it possible to ensure uninterrupted mining at the deposit at the same vertical rate of the TNW removal and the speed of deepening in both selected sections of the deposit.
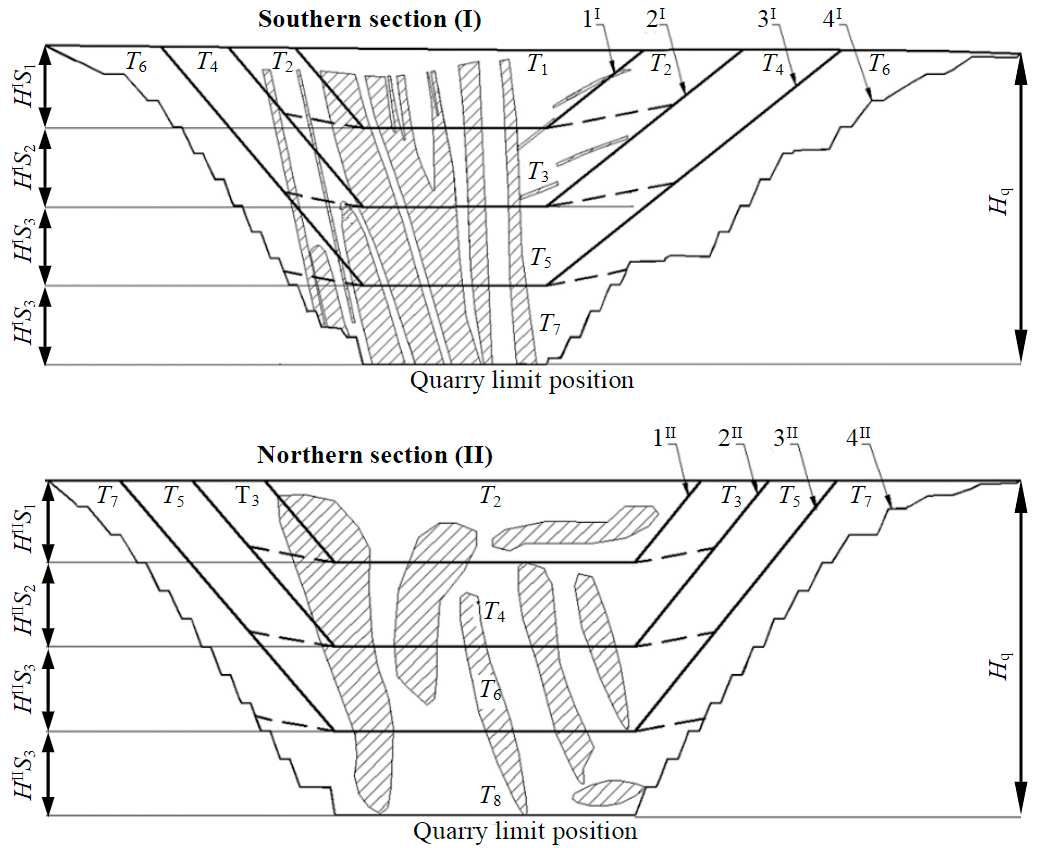
Fig.1. The mining order by stages of a quarry divided into two sections Tn – deposit development period; HISn, HIISn – stage depth in the first and second sections, respectively; 1I-4 – section boundaries; Hq – quarry depth at the end of mining
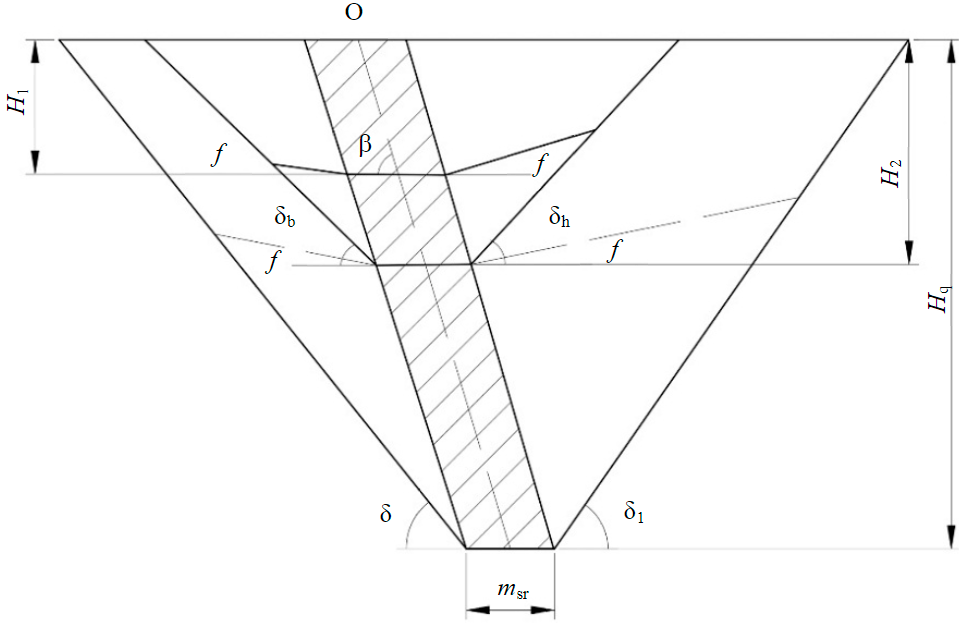
Fig.2. Scheme of the working area development in a quarry during mining a steeply dipping ore deposit in stages H1, H2 – depth of the first and second stages, m; β – ore body dipping angle, deg; δb, δh – slope angle of the temporarily non-working wall from the side of the bottom and hanging walls of the deposit, deg; δ, δ1 – slope angle of the quarry wall in the final position, deg; f – slope angle of the working wall with working ramps of normal width, deg; msr – ore body thickness, m; O – ore body dipping axis
Since, according to the proposed mining scheme, within the stage limits, the slope angle of the working wall of the quarry can increase significantly, it becomes possible to preserve large volumes of overburden. The postponement of overburden excavation for future stages makes it possible to increase the deposit productivity in terms of minerals, which enables to increase the mining efficiency in market conditions of price volatility and variable demand for raw materials [2, 9].
The calendar plan for the development of overburden and mining operations in a deposit mined without distinguishing stages, as a rule, contains one main period of normal operation, which is characterized by stable annual volumes of minerals and overburden. If the deposit is developed in stages or with the use of temporarily non-working walls, then the graphic representation of the ca-lendar plan is stepped (the number of steps corresponds to the number of spatial stages in quarry development).
The growth in demand for mineral raw materials determines (with or without stages) mining operations with maximum intensity. Therefore, an increase in the quarry productivity is possible only if the area of the ore body involved in mining increases [4].
It is advisable to take the duration of the development stage as long as possible if the stripping ratio in this period is less than the stripping ratio in the subsequent period. Therefore, mining with the maximum duration of the first calendar stage is the most effective.
While creating an analytical model for the development of a quarry space during mining in two stages, it is advisable to consider the quarry contour and the ore body as simplified regular geometric figures (Fig.2). A mineral deposit with simple occurrence conditions is normalized to a regular shape with a sufficient degree of accuracy by constructing a steeply dipping ore body by the average values of the true thickness and dipping angle of the ore body [5, 10-12].
The stage-wise development of a quarry field within the final quarry limits suggests a wide range of possible values for the first stage depth.
For the economic evaluation of the investment project, the net present value from the deposit development project should be used [13, 14]
Let us write out the difference in cash flows
where Rt is the results achieved at the t-th stage of the project implementation, rub.; Ext – expenses at the t-th stage of the project implementation, rub.; P – ore price, rub./m3; C – cost of ore, rub./m3; Ap – quarry mineral productivity, m3/year.
Ore mining cost is determined by the formula:
where Cm – specific operating costs for mining of 1 ton of ore (without overburden operations), rub./t; Сo – specific operating costs per 1 m3 (1 t) of overburden, rub./m3 (rub./t); Ko – current overburden ratio, m3/t (m3/m3, t/t).
NPV formula with values substituted from equation (1):
where K – capital costs for the project implementation, rub.; E – discount rate; T – working time; t – year.
The quarry mineral productivity is determined by the following formula [15]:
where φ – slope angle of the quarry working wall, deg.; h – bench height, m; h0 – deepening rate, m/year; Lbl – length of the work front per excavator, m; β – deepening angle, deg; η – ore loss index; ρ – ore impoverishment index.
Deepening angle [16]
where B – standard width of working ramps, m; α – bench slope angle, deg.
Substituting all the dependencies obtained into the original formula, we get the net present value of the field development:
As a rule, deep ore quarries are mined over a very long period of time. Thus, reinvestment of capital takes place during its operation [17-19]. Investment is the capital flow in the mine construction and the income stream from operation, discounted at an assumed interest rate (i).
The net present value can be understood as the net present value of the project, the total discounted profit, or the net profit of the investment project.
In world practice, net present value (NPV) is used as the main tool for assessing the economic efficiency of design decisions. NPV calculation methods consider all items of expenses and income of the enterprise, which is confirmed by reference sources [20, 21]. Thus, in further calculations, the generally accepted international symbol NPV was used. For a correct assessment of the project using the net present value criterion, it is necessary to choose the discount rate, time period of the assessment, as well as the formulas for determining NPV. Calculation methods may differ in the presence or absence of the residual project value in the formula, which is normalized to the moment of planning by discounting. NPV shows only the quality of the net cash flow from the project implementation at the accepted discount rate.
When comparing different options for the implementation of investment projects, it is necessary to consider the risk of losing money, which is determined by the probability of a change in the interest rate [3, 22, 23]. This risk is characterized by possible capital losses from the expected interest gain and is calculated as the difference between the internal rate of return (IRRpi) and the rate of return calculated from the equality of discounted capital investments to the discounted income stream minus it during the payback period of capital investments [24]
where Tpb – payback period of capital investments at the rate i; It – amount of investment in the design, construction, and operation of a quarry in the t-th year; NCj – net current profit from quarrying in the j-th year; iR – rate of return; n – ordinal number of the assessment year.
Interest rate of reinvestment [21]
The net present value of the project (including reinvestment) is a dynamic value for assessing the effectiveness of capital investments in the quarry development, considering interest without the risk of losing investments [25, 26].
The net present value of the project, considering the increase in income since its inception at the reinvestment interest rate
where Tper is the quarry construction period, years.
To account for changes in investment values, a discount factor is used, which is necessary to normalize economic values of various times to a single point in time [21, 25],
Each option for dividing a quarry field into the development stages, due to the complex dependence of the parameters and indicators of mining operations on the stage depth Hst, is characterized by obtaining different net present values of the project implementation [27].
Research methodology
To assess the sensitivity of NPV to changes in indicators, we consider the period of quarry mining within one stage by transforming formula (3):
Net current profit is determined using formula (2):
Let us write formula (5) by substituting the quarry productivity value from formula (2),
The deepening rate of a stage is defined as the stage depth ratio to the time of its completion
where Tn is the stage completion time, year.
Substituting all the dependencies obtained into formula (4), we calculate the criterion indicator for determining NPV for the first stage of mining:
where Pr – ore concentrate price, rub./t; C – cost of ore mining and ore concentrate production rub./t; qj-n=(1+i)-n – discount factor for the net current profit at the first stage of quarry mining in the j-th year; qω-n=(1+i)-n – discount factor for investments in the quarry construction in the ω-th year; qm-n=(1+i)-n – discount factor for investments in reconstruction in order to move to the second stage of mining in the m-th year; Kω – amount of investment in the quarry construction in the ω-th year;
Km is the amount of investment in reconstruction in order to move to the second stage of mining in the m-th year.
Based on the results of generalization and analysis of data on quarries and analogous deposits, the values of the ranges of changes in the studied mine engineering and economic factors were taken. To determine the measure of significance of the studied factors on the NPV, we estimate the range of change for each of the factors (see Table).
Initial data for the analysis of the sensitivity of performance parameters and indicators-arguments to the NPV
|
Parameter |
Range |
Average value |
Increment |
|
Bench height h, m |
12-19 |
15 |
1 |
|
Work front length Lbl, m |
1200-2600 |
1800 |
200 |
|
Working ramp width B, m |
30-65 |
45 |
5 |
|
Slope angle of the quarry working wall φ, deg |
12-19 |
15 |
1 |
|
Ore loss η |
0.02-0.048 |
0.032 |
0.004 |
|
Ore dilution ρ |
0.01-0.15 |
0.07 |
0.02 |
|
Bench slope angle, deg α |
50-85 |
65 |
5 |
|
Stage depth Hst, m |
70-210 |
130 |
20 |
|
Stage time Tj, year |
11-18 |
14 |
1 |
|
Ore concentrate price Pr, rub./t |
200,000-270,000 |
250,000 |
10,000 |
|
Cost of ore mining and ore concentrate production С, rub./t |
30,000-65,000 |
47,500 |
5000 |
|
Discount factor for net operating income at the first stage of quarry mining in the j-th year qj, monetary unit |
0.287-0.13 |
0.205 |
– |
|
Discount factor for investments in the quarry construction in the ω-th year qw, monetary unit |
0.893-0.404 |
0.636 |
– |
|
Discount factor for investment in reconstruction in order to move to the second stage of mining in the m-th year qm, monetary unit |
0.567-0.257 |
0.404 |
– |
|
Amount of investment in the quarry construction Kw, |
10,000-17,000 |
13,000 |
1000 |
|
Amount of investment in reconstruction in order to move to the second stage of mining Km, million roubles |
300-1000 |
600 |
100 |
When calculating dependence (6), we use the average values of indicators
Then, in a similar way, we substitute the average values of all the factors under consideration, changing only the values of the argument under study. Thus, by changing the value of one of the parameters, it is possible to assess the measure of influence of each indicator on the NPV [28, 29].
To assess the measure of influence of factors on the change in the NPV, the coefficient of elasticity is used. It shows by what percentage the estimated parameter will change when one of the studied indicators is transformed [28, 30, 31]
where n is the number of points; yi is the function value at the i-th point; ∆yi is the function increment at the i-th point; xi is the argument value at the i-th point; ∆xi is the argument increment in the i-th point.
Thus, when analysing the results obtained, a number of significant performance factors can be identified that have the greatest impact on the estimated NPV.
Figures 3, 4 show the dependence graphs of the quarry mine engineering parameters and the economic indicators of mining on the relative change in NPV.
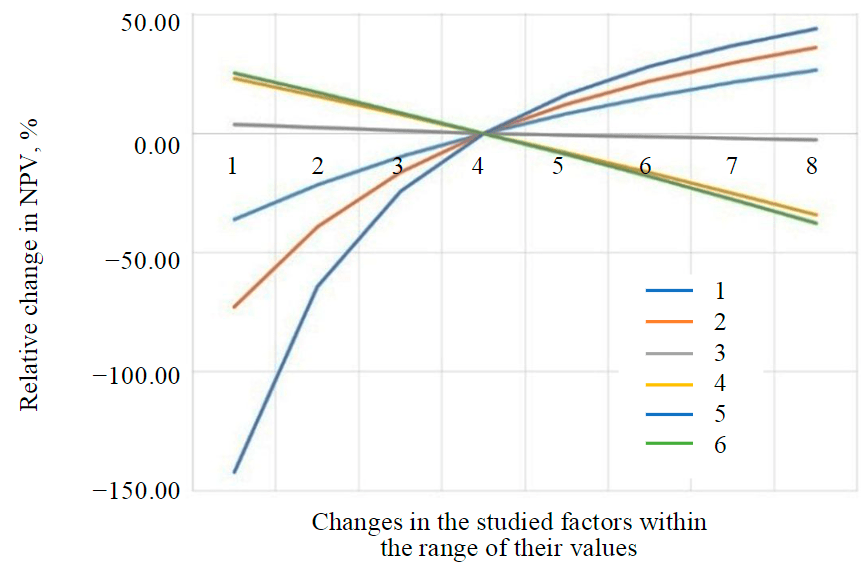
Fig.3. Influence of quarry mine engineering parameters on the relative change in NPV 1 – bench height; 2 – block length; 3 – ramp width; 4 – working wall slope angle; 5 – stage depth; 6 – stage duration
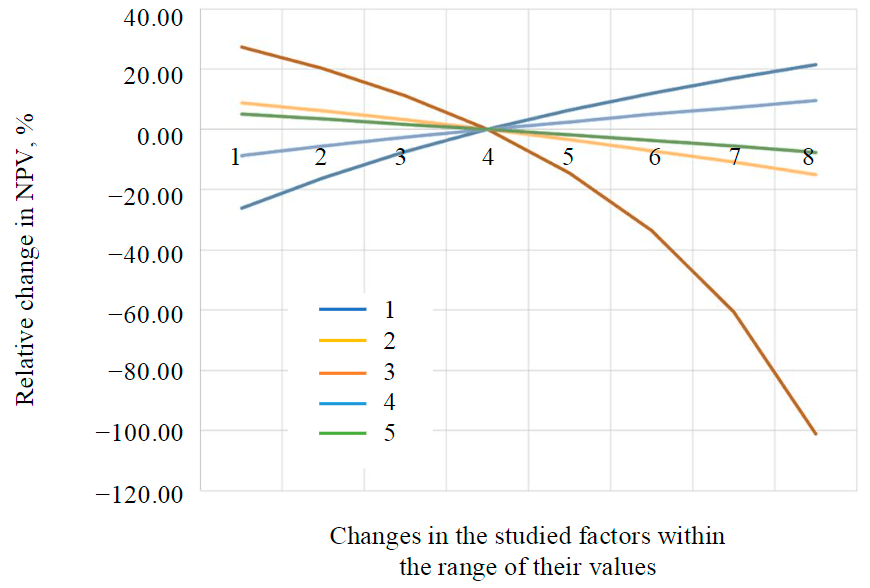
Fig.4. Influence of the quarry economic parameters on the relative change in NPV 1 – ore price; 2 – cost of ore mining; 3 – discount factor during the development of the first stage; 4 – discount factor during the construction period; 5 – amount of investment during the construction period
By the measure of influence of the quarry mine engineering parameters on net present value, they are divided into two groups. Values that have a considerable influence belong to the group of values of high importance (stage duration, bench height, working wall slope angle, block length, stage depth), the rest of the values fall into the group of low importance (working ramp width) [20, 28].
By the measure of influence of the quarry economic parameters on the net present value, three groups of values can be distinguished that affect the importance of the parameter under study: high importance – ore price, discount factor during the mining stage; medium importance – production cost, discount factor during the construction period, amount of investment during the construction period; low importance.
Figure 5 shows a graph reflecting the results of determining the coefficient of elasticity for mine engineering and economic parameters and indicators of the deposit. Values exceeding 100 % indicate that when the parameter changes in the accepted range, the NPV changes more than twice.
Economic indicators (profit, capital costs), as well as the duration of the development stages are functionally associated with the operational overburden removal ratio and the stage depth. Let us assume that all the indicated factors that influence the rational depth of the development stage remain unchanged at the level given in the table (average values), with the exception of one, the factor under study. In this case, each value of the studied factor corresponds to a certain value of the rational depth of the stage. When the factor changes, we obtain a corresponding change in the rational depth of the stage. The rational depth of the development stage is significantly influenced by factors related to the current volumes of mining operations and time parameters. For the considered limits of determining factors, the ratio of the final depth of the quarry and the rational depth of the development stage is in the range of 44-67 % and has an average value of about 55 %.
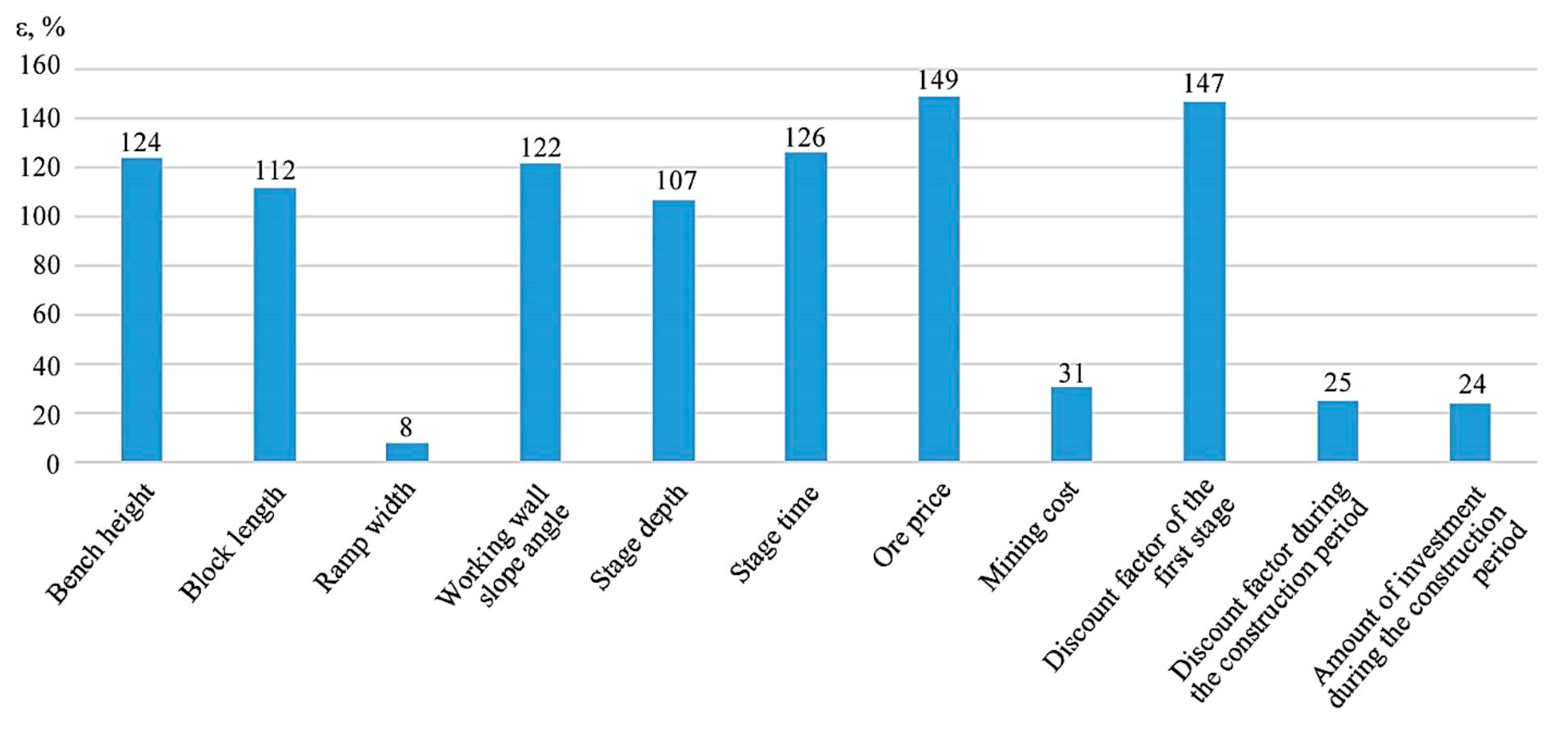
Fig.5. Coefficient of elasticity for various performance parameters and indicators
Conclusion
The main quarry parameters when designing mining in stages are significantly influenced by the adopted parameters of the stage, which significantly affect the economic efficiency of mining in general. It is customary to conduct a comparative evaluation of investment projects according to the maximum NPV criterion. Using the proposed methodology, it is possible to analyse the measure of influence of the parameters and indicators of the development stage on the change in net present value and determine the optimal values for each stage parameter.
As a result of the analysis of the influence of numerous factors on the NPV, the following conclusions can be drawn:
- The value of the total discounted income is significantly influenced by a number of economic and mine engineering factors during the development of the first stage.
- With the accepted average values, the considered factors, by the measure of their influence on the NPV, are arranged in decreasing order as follows: discount factor during the first stage of mining, ore price, discount factor for the first stage, mining stage duration, bench height, working wall slope angle, working block length, stage depth, ore mining cost, discount factor during the construction period, amount of investment during the construction period, working area width.
It was established that in order to make effective design decisions at the first stage of mining of open-pit reserves, their feasibility study is necessary according to the NPV criterion, considering the measure of influence of mine engineering factors, determined using the proposed methodology and expressed by the coefficient of elasticity.
Economic indicators (profit, capital costs), as well as the duration of the development stages are functionally associated with the operational overburden removal ratio and the stage depth.
The results of the analysis of the influence of numerous factors on the rational depth of the first stage of development allow us to draw the following conclusions:
- The rational depth of the development stage is significantly influenced by factors related to the current mining volumes and time parameters.
- For the considered limits of determining factors, the ratio of the final depth of the quarry and the rational depth of the development stage is in the range of 0.44-0.67, the average value is 0.55.
- For the accepted average values of the initial data, depending on the coefficient of elasticity, the factors influencing the rational depth of the stage are distributed from the most significant to the least significant: final depth of the quarry, slope angle of the TNW, interest rate, progress rate of mining operations during the open cut of the TNW, cost of overburden removal, specific capital investment.
- Comparative economic evaluation of field development options does not depend on the point at which costs are reduced, but this point should be the same for all compared options. All costs should be reduced to the starting point of the field operation. Thus, the entire time of operation is divided into two periods: the period of quarry construction and the period of direct operation. The financial costs of building a quarry are considered as past costs, and operating costs are considered as future costs.
References
- Rakishev B.R., Moldabaev S.K. Оrder of mining of close steeply falling ores on example of Lomonosov deposit of iron ore. Mining informational and analytical bulletin. 2016. N 9, p. 284-295 (in Russian).
- Yakovlev V.L., Sakantsev G.G., Yakovlev A.V., Perekhod T.M. Regulation of the mining mode on deep quarries of big extension with the use of combined temporarily non-working boards. Problems of Subsoil Use. 2020. N 1 (24), p. 18-25 (in Russian). DOI: 10.25635/2313-1586.2020.01.018
- Kosolapov A.I., Ptashnik A.I., Ptashnik Yu.P. Analysis of possibility productive capacity variation on open-pit mining with sloping ore deposits. Mining informational and analytical bulletin. 2013. N 9, p. 55-61 (in Russian).
- Kosolapov A.I., Ptashnik A.I. The study on the potential possibilities of the intensification of the productive capacity during staging development of the steeply dipping deposits in the modern conditions. Mining informational and analytical bulletin. 2011. N 6, p. 50-66 (in Russian).
- Holodnyakov D.G., Loginov E.V. Mode control of mining operations and the angle of repose of the working pit. Mining informational and analytical bulletin. 2015. N 2, p. 71-74 (in Russian).
- Bekher V.G. Methodological basis for justification of the parameters of open pit mining stages in the conditions of changing prices on the coal market. Mining informational and analytical bulletin. 2021. N S8, p. 3-10 (in Russian).
- Rakishev B.R. Classification of technological complexes of the opencast mining. Mining informational and analytical bulletin. 2014. N S1, p. 297-306 (in Russian).
- Rakishev B.R., Moldabayev S.K. Appropriate technology of open-pit mining with the use of motor vehicles. Mining informational and analytical bulletin. 2015. N 1, p. 27-34 (in Russian).
- Alenichev V.M., Sytenkov V.N., Kornilkov S.V., Yakovlev V.L. Open pit management strategy. Gornyy zhurnal. 2020. N 3, p. 34-39. DOI: 10.17580/gzh.2020.03.06
- Belyakov N.N. Modeling of open pits. Mining informational and analytical bulletin. 2014. N 12, p. 45-51 (in Russian).
- Fedotov G.S., Pastikhin D.V. Influence of access road pattern on mine rock volume within the ultimate pit limit. Mining informational and analytical bulletin. 2019. N 6, p. 115-123 (in Russian). DOI: 10.25018/0236-1493-2019-06-0-115-123
- Nemova N.A., Belsh T.A. Assessment of pit wall and pit bottom reserves working options in the mine “Oleniy ruchey”. Bulletin of the Tomsk Polytechnic University. Geo Assets Engineering. 2020. Vol. 331. N 2, p. 45-51 (in Russian). DOI: 10.18799/24131830/2020/2/2480
- Titova A.V., Golik V.I. On Diversification of Ore Mining Complex as Direction for Development of Depressive Economic System. Russian Mining Industry. 2020. N 6, p. 112-117 (in Russian). DOI: 10.30686/1609-9192-2020-6-112-117
- Tolobekova B.T. Features of the modern mining projects management. Problemy nauki. 2018. N 5 (29), p. 117-119.
- Kholodnyakov G.A., Abdulaev M.D. Dependence of open pit ore productivity on bench height. Journal of Mining Institute. 2014. Vol. 207, p. 84-86 (in Russian).
- Vedrova D.A., Reshetnyak S.P. Methods to improve the waste rock dumping efficiency and reclamation under the north condition. 5th International Conference “Arctic: History and Modernity”, 18-19 March 2020, Saint-Petersburg, Russia. 2020. Vol. 539. DOI: 10.1088/1755-1315/539/1/012037
- Zaitsev A.Yu. Methodological Approach to Substantiation of Capital Investments of Gold Fields Based on Unit Costs. Journal of Mining Institute. 2019. Vol. 238, p. 459-464. DOI: 10.31897/PMI.2019.4.459
- Katysheva E.G. Industry-specific features of the formation of proper financial resources at mining enterprises. Novyy vzglyad. Mezhdunarodnyy nauchnyy vestnik. 2014. N 4, p. 172-185.
- Cherskih O.I. Procedure to select technical-technological solutions on rational mining mode at open pit coal mine with thick gently dipping seams. Mining informational and analytical bulletin. 2015. N S1-1, p. 275-290 (in Russian).
- Sokolov I.V., Smirnov A.A., Nikitin I.V. Methods of economic assessment of strategic decisions at the combined mining of ore deposits. Izvestiya Tula State University. Sciences of Earth. 2021. N 3, p. 314-325 (in Russian). DOI: 10.46689/2218-5194-2021-3-1-308-319
- Sinha S.K., Choudhary B.S. Pit Optimization for Improved NPV and Life of Mine in Heterogeneous Iron Ore Deposit. Journal of The Institution of Engineers (India): Series D. 2020. Vol. 101, p. 253-264. DOI: 10.1007/s40033-020-00236-z
- Peshkova M.K., Shulgina O.V. Modern methods of evaluation of investment attractiveness of companies mineral complex. Mining informational and analytical bulletin. 2015. N S1, p. 193-208 (in Russian).
- Kazanin O.I., Sidorenko A.A., Meshkov A.A., Sidorenko S.A. Reproduction of the longwall panels: Modern requirements for the technology and organization of the development operations at coal mines. Eurasian Mining. 2020. Vol. 2, p. 19-23. DOI: 10.17580/em.2020.02.05
- Fomin S.I., Pasynkov D.V., Semenov A.S. Determining the effectiveness of investments in the implementation of ore open-pit projects. Journal of Mining Institute. 2009. Vol. 180, p. 12-14 (in Russian).
- Gilani S.-O., Sattarvand J., Hajihassani M., Abdullah S.S. A stochastic particle swarm based model for long term production planning of open pit mines considering the geological uncertainty. Resources Policy. 2020. Vol. 68, N 101738. p. 8-12. DOI: 10.1016/j.resourpol.2020.101738
- Ligotsky D.N., Mironova K.V. Perspective technology of open-pit mining of limestone and dolomite. Journal of Engineering and Applied Sciences. 2018. Vol. 13. Iss. 7, p. 1613-1616. DOI: 10.36478/jeasci.2018.1613.1616
- Fathollahzadeh K., Ali Asad M.W., Mardaneh E., Cigla M. Review of Solution Methodologies for Open Pit Mine Production Scheduling Problem. International Journal of Mining, Reclamation and Environment. 2021. Vol. 35. Iss. 8, p. 564-599. DOI: 10.1080/17480930.2021.1888395
- Fomin S.I., Bazarova E.I. Sensitivity analysis of ore open pit parameters at the preliminary designing stage. Journal of Mining Institute. 2015. Vol. 216, p. 76-81 (in Russian).
- Loginov E., Ligotsky D., Argimbaev K. Averaging the operating stripping ratio for sinking mining systems based on mathematical simulation. Journal of Physics: Conference Series. 2020. Vol. 1614. DOI: 10.1088/1742-6596/1614/1/012050
- Galiev Zh.K., Galieva N.V. Efficiency of functioning of the large coal-mining enterprises. Ugol’. 2019. N 6 (1119), p. 59-63 (in Russian). DOI: 10.18796/0041-5790-2019-6-59-63
- Zuev B.Yu., Zubov V.P., Fedorov A.S. Application prospects for models of equivalent materials in studies of geomechanical processes in underground mining of solid minerals. Eurasian Mining. 2019. Vol. 1, p. 8-12. DOI: 10.17580/em.2019.01.02