
Comprehensive studies of the snow-firn layer in the area of the Russian Antarctic Vostok Station
- 1 — Ph.D. Scientific Supervisor of the Laboratory Empress Catherine ΙΙ Saint Petersburg Mining University ▪ Orcid
- 2 — Ph.D. Head of Department Empress Catherine ΙΙ Saint Petersburg Mining University ▪ Orcid
- 3 — Ph.D. Associate Professor Empress Catherine ΙΙ Saint Petersburg Mining University ▪ Orcid
- 4 — Leading Engineer Empress Catherine ΙΙ Saint Petersburg Mining University ▪ Orcid
- 5 — Ph.D. Assistant Lecturer Empress Catherine ΙΙ Saint Petersburg Mining University ▪ Orcid
- 6 — Postgraduate Student Empress Catherine ΙΙ Saint Petersburg Mining University ▪ Orcid
- 7 — Postgraduate Student Empress Catherine ΙΙ Saint Petersburg Mining University, ▪ Orcid
Abstract
The article presents the findings from research conducted at Vostok Station during the 69th Russian Antarctic expedition. The primary goal of the research is to perform a thorough investigation of the snow-firn layer using both direct (drilling and core analysis) and indirect (georadiolocation and seismic exploration) methods. As part of the research, fundamental tasks related to the study of the structure and dynamics of the upper part of the ice sheet were addressed, as well as applied tasks aimed at justifying the depth of explosive charge placement for seismic work with the goal of conducting a detailed study of Lake Vostok and selecting the point for drilling access to the lake. Data on the microstructure and physical properties of the snow-firn layer were collected. The findings will allow for future improvements to the firn densification model, which is required to understand the evolution of ice grains during the early stages of metamorphism. The study's findings aided in the understanding of the structural features of the ice sheet's surface layer, allowing for more precise determination of the structural and physical characteristics of the snow-firn layer and ice, potentially leading to a better understanding of climatic and geological processes in Antarctica.
The research was carried out with the help of a subsidy for the implementation of the state task in the field of scientific activity for 2024 N FSRW-2024-0003.
Introduction
Geophysical and drilling operations are the primary sources of information required for the study of glaciers, subglacial water bodies, and bedrock in Antarctica, and their combination allows for the collection of the most reliable data about the geological object under investigation.
Geophysical work on the sixth continent is represented by radar and seismic surveys, which use electromagnetic and elastic waves that propagate well through ice. Gravimetry, magnetometry, and laser altimetry are also applied. Domestic and foreign specialists have been able to determine the thickness of the ice sheet and identify features of Antarctica's subglacial topography as a result of extensive research [1-4]. One of the most interesting geophysical studies carried out by Russian scientists is the comprehensive seismic and radar studies of Lake Vostok, the world's largest subglacial water body, conducted by the Polar Marine Geological Exploration Expedition from 1995 to 2015 [1, 5, 6].
When drilling glaciers, mechanical and thermal methods have proven to be effective [7, 8]. The most significant project implemented by Russian specialists, employees of the Leningrad Mining Institute (now Empress Catherine ΙΙ Saint Petersburg Mining University), is the drilling of the deep borehole 5G at the Vostok Station and the unsealing of the eponymous subglacial lake in 2012 and 2015 [9].
A new stage of scientific research in Antarctica is associated with solving the tasks of Activity 21 “Comprehensive studies of the subglacial Lake Vostok and the Earth's paleoclimate in the area of the Russian Antarctic Station Vostok” (Order of the Government of the Russian Federation dated June 30, 2021, N 1767-r On the approval of the action plan for the implementation of the Strategy for the Development of the Russian Federation's Activities in Antarctica until 2030) which cannot be accomplished without the combined use of geophysical and drilling works in the study of the unique natural objects in this area of Antarctica. The new Vostok Station wintering complex, which opened in January 2024, will serve as the central of gravity for future scientific research.
From December 2023 to February 2024, as part of the 69th Russian Antarctic Expedition (RAE) season at the Vostok Station, employees of Saint Petersburg Mining University worked on a comprehensive study of the snow-firn layer (SFL) using both indirect (ground-penetrating radar and seismic surveys) and direct (drilling and microstructural analysis) research methods.
Knowledge of the microstructural structure and composition of SFL inclusions provides insight into the evolution of ice grains at various stages of catagenesis, allowing reconstruction of their growth, deformation, and post-sedimentary transformations. The accumulated data enable the improvement of existing models of the firn densification process – a problem that has only been partially resolved to date [10-13]. The features of the microstructure of the near-surface part of the Antarctic ice sheet, including grain morphology and orientation, data on intergranular spatial relationships, and others, determine the physicomechanical characteristics of the deposits [14-16]. This information enables the reconstruction of firn formation conditions [17, 18], environmental temperature and dynamics, and the selection of optimal drilling parameters and technologies [19-21].
Glaciers contain unique information about the composition and temperature of the atmosphere, which allows for the reconstruction of paleoclimatic conditions on Earth. In the upper part of the Antarctic ice sheet, data on volcanic eruptions, forest fires, anthropogenic pollution, and snow accumulation rates over the last few thousand years are concentrated [22, 23]. SFL research is conducted both within the context of global international projects and as individual research [24-27]. The International Partnership in Ice Core Sciences (IPICS) is actively implementing projects, the most notable of which are CLIVASH2k [28] and IPICS 2k [29]. These projects aim to create and study a global dataset on climate change on our planet over the last 2,000 years using information from ice cores.
Methods
Geophysical research and mathematical modeling
Mathematical modeling of synthetic ground was performed to support the system of seismic observations at the 69th RAE, which were conducted from profiles located 1 km northeast of the Vostok Station (Fig.1).
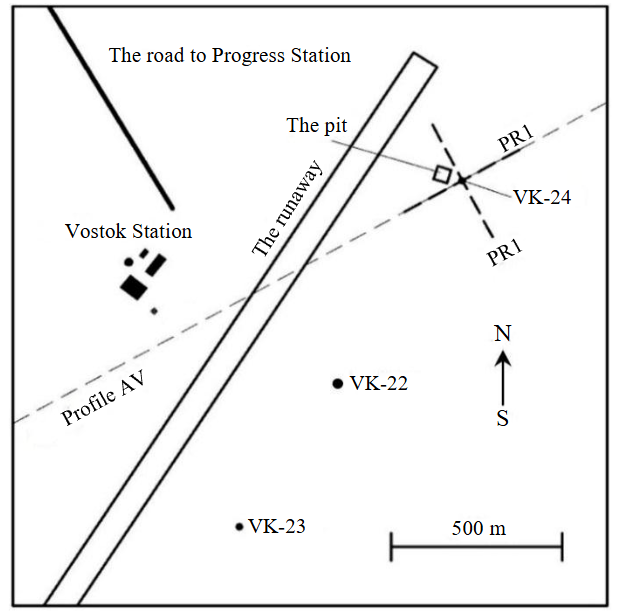
Fig.1. Diagram of the location of boreholes VK-22, 23, 24, the pit, seismic and ground-penetrating radar profiles (PR1, 2), AV – deep seismic profile [6]
D.E.Ushakov, an engineer at the Arctic Scientific Center of the Mining University, calculated the depth-dependent change in the velocity of propagation of longitudinal waves in the SFL of the Vostok Station area. The calculation was based on the density profile obtained by Russian researchers in the area surrounding the Vostok Station [23]. The essential study, which elucidates the correlation between the propagation velocity of longitudinal waves and the density of the SFL, is publication [30], which offers an empirical relationship between the density profile of the SFL and the propagation velocity of longitudinal waves:
where ρ is the density of the SFL, g/cm3; Vp is the velocity of longitudinal waves, km/s; Vp,ice = 3.864 km/s is the velocity of longitudinal waves in ice [31].
Using the density profile of the SFL from [23] and function (1), a theoretical medium velocity model was calculated to predict elastic wave propagation velocity in the studied horizon (Fig.2, a).
The constants in dependence (1) differ from station to station and continent to continent. According to the study [30], these constants were determined using seismic data and SFL densities in the areas of both Byrd stations in West Antarctica, and they were tested against examples from drilling operations in Antarctica and Greenland. Such constants for the Vostok Station are not found in the published literature and were most likely not determined at all; however, the values of constants given in [30] can be used for the modeling task to validate the seismic observation system.
In [32], a graph of formation velocities of longitudinal waves obtained from the results of vertical seismic profiling performed in borehole 5G is presented. The formation velocities in ice layers at depths of more than 100 m vary from 3.82 to 4.12 km/s. In modeling the synthetic ground, the underlying medium was modelled as homogeneous with an elastic wave propagation velocity of 3.9 km/s in order to avoid studying the structure of the upper part of the section.
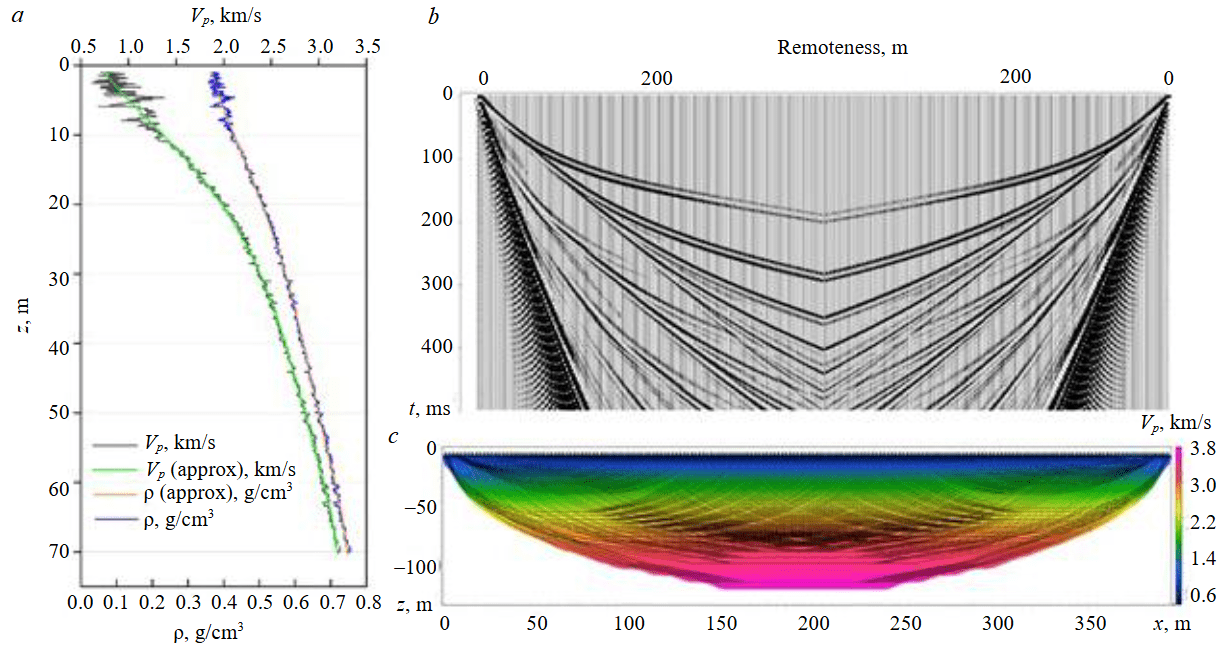
Fig.2. The dependence of the velocity of longitudinal waves and density on depth (a); flanking synthetic ground (b); the result of tomographic processing of synthetic ground (c)
Vp is the velocity of longitudinal waves; Vp (approx) is the approximate theoretical curve of the velocity of longitudinal waves; ρ is the density of the SFL; ρ (approx) is the approximate theoretical curve of the flatness of the SFL; z is the depth; black lines on the depth-velocity section are the trajectories of seismic rays
Modeling of synthetic ground (Fig.2, b) was carried out in Tesseral Pro software (Tesseral Technologies Inc, Canada). It is understood that continuously refracted waves propagate in a medium with a positive gradient (smooth increase) in wave velocity with depth. Such waves are distinguished by a continuous variation in the beam inclination angle with depth. According to the law of refraction, a ray entering a point on the earth's surface cannot penetrate deeper than the limiting depth at which the angle of refraction is 90°. Hence, we can conclude that the depth of the method depends not only on the velocity characteristics of the medium, but also on the observation base (explosion-device) or maximum distance. The greater the distance, the more deeply the recorded seismic refracted wave penetrates the investigated medium. The depth of investigation for the method of first arrivals is traditionally thought to range between 1/4 and 1/10 of the maximum distance. Thus, to investigate a 100-meter-thick SFL, an observation base ranging from 400 to 1,000 m is required. The simulations were run with a maximum distance of 400 m between the source point (SP) and the receiver point (RP). The synthetic ground (Fig.2, b) depicts the time-distance curves of the continuously refracted waves emerging in the early stages. To determine the depth of penetration of seismic rays, the calculated synthetic ground was tomographically processed using the ZondST2D program (ZOND Geophysical software, Russia). Figure 2, c depicts the result.
The processing results show that the maximum depth of penetration of seismic rays at such SP-RP distances is 100-110 m, allowing the section to be studied to its full target depth under favorable seismogeological conditions.
Field observations
During the 69th RAE season, the authors had two seismic recording systems at their disposal: cable-free SCOUT (SKB-SP, Russia) (28 channels) and cable TELSS-3 (Geosignal, Russia) (96 channels, pitch of receiver points – 2 m). The maximum SP-RP distance that can be obtained on TELSS-3, excluding remote source points, is 190 m. The length of the receiving formation, which was missing from the 400 m determined by the modeling results, was added to the flanks of the TELSS-3 formation by cable-free autonomous SCOUT recorders spaced at 8 m (Fig.3, a), which were chosen based on the study objectives and equipment availability. Furthermore, during the work, remote source points were installed, allowing for the maximum 424 m SP-RP removals.
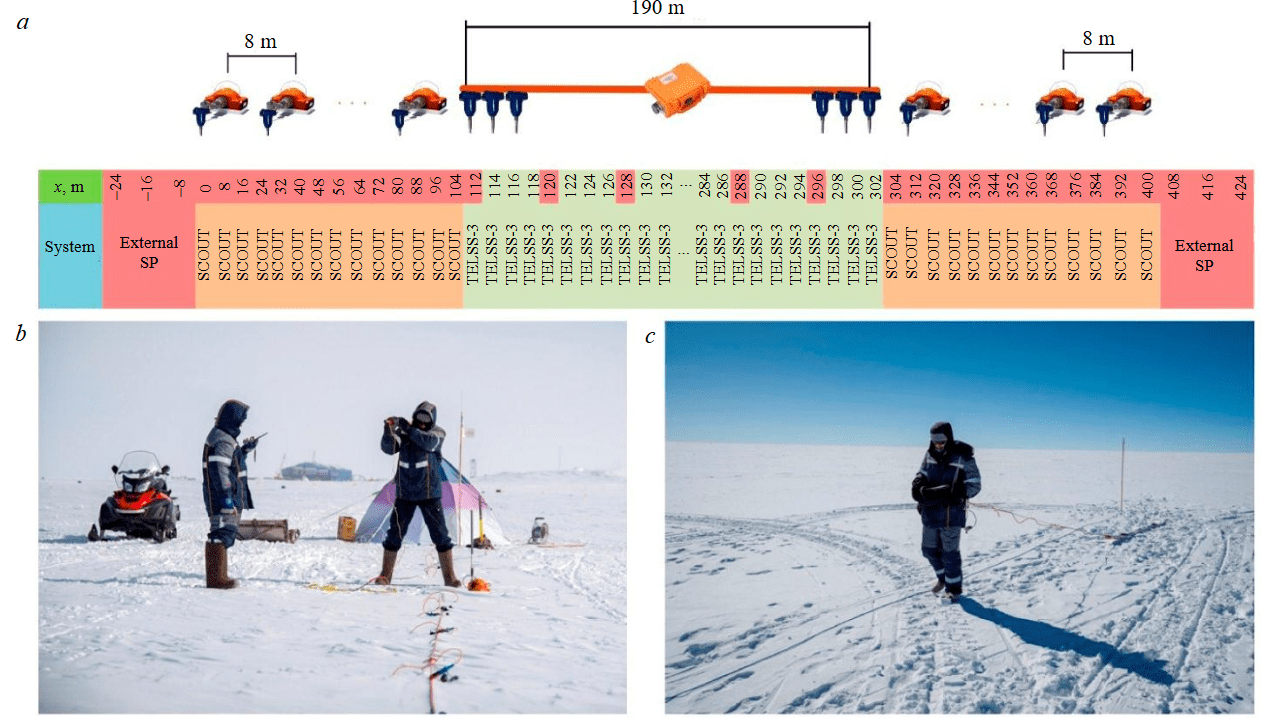
Fig.3. Location of seismic recording systems on the profile (a), seismic exploration (b) and georadiolocation work (c) in the area of the Vostok Station
When processing the results of shallow-depth seismic surveys, it was discovered that the quality of data recorded by the SCOUT cable-free system was significantly lower than that of the TELSS-3 telemetry system, so it was decided to process only the results obtained by the cable seismic station. The planned profile binding was completed with a Garmin GPSMAP 66 ST portable GPS satellite navigator (Garmin Ltd., USA). The seismic energy injection was triggered by striking a metal die with a construction sledgehammer (Fig.3, b). The moment of impact with the station was synchronized by closing the sledgehammer and die simultaneously. The seismic station operator was in a specially equipped tent on the profile, which allowed him to work with the seismic recording system in fairly comfortable conditions while being protected from the wind. The tent was heated in the sun, which led to an increase in its temperature relative to the ambient air by 3-5 °C and had a positive effect on the operation of the equipment (TELSS-3 station interface, battery, and laptop).
In addition to seismic surveys, georadiolocation studies were carried out at the Vostok Station during the 69th RAE season. The georadiolocation method is based on the phenomenon of an electromagnetic wave reflecting off inhomogeneities in a geologic cross-section, where abrupt changes in the medium's electrical properties, such as electrical conductivity and dielectric constant, are observed. Georadiolocation was performed on the same profile as seismic surveys using the OKO-2 ground-penetrating radar (LogiS, Russia) and the ABDL – Triton antenna unit (LogiS) at a sounding pulse carrier frequency of 100 MHz (Fig.3, c). The geo-radar section was connected to the terrain via a rope marked at five-meter intervals and stretched along the research profile. When the center of the radar antenna was opposite the tag, the operator attached an electronic tag to the radarogram, allowing him to precisely position the received radarogram on the profile.
Core drilling and the pit
To confirm the geophysical data, a 50-meter-deep borehole VK-24 was drilled at coordinates 78°28'21'' S, 106°46'56'' E, 70 m east of the runway and 1,200 m northeast of the Vostok Station. The borehole's location was chosen based on the deep seismic profile AV [6] (see Fig.1) at the intersection of profiles PR1 and PR2, along which ground-penetrating radar and shallow seismic surveys were carried out. Drilling was done with the LGGE drill. (Laboratoire de Glaciologieet Géophysique del’ Environnement, France) [33]. Core material was collected during each drilling run, with a specified run length of 0.5 m along the cable. After drilling, the snow-firn cores were delivered to the 5G well drilling complex's laboratory, where they were joined and measured for length, weight, density, ultrasonic wave velocity, and microstructural features.
The physical properties of the SFL at a depth of up to 5 m did not allow for the extraction of a core of sufficient quality for further study, so a pit 5.5 m deep was dug 10 m from the VK-24 well to study the near-surface part of the section. The working wall of the pit is oriented to the north. The depth of the pit was monitored using a tape measure hung along the working wall.
The SFL core extracted from a shallow borehole, as well as the pit sampling results, were studied in three ways: microstructural features were analyzed, density was measured, and ultrasonic wave propagation speed was calculated.
Analysis of microstructural features
The microstructural features of rocks were studied by examining rock thin sections under a microscope in transmitted, usually polarized light. In geology, thin sections are made by grinding a sample attached to a glass slide on a rotating mechanical disk until a thin plate (0.02-0.03 mm) is obtained [34]. Canada balsam is used as an adhesive, less commonly other resins. In thin sections, most minerals become transparent, allowing for their reliable identification based on various optical properties.
The physical and mechanical properties of firn do not allow for the production of sufficiently transparent thin sections. The study of the microstructural features of SFL in the area of the Vostok Station was conducted in the glaciological laboratory of the drilling complex at borehole 5G. Plates with a thickness of 5 mm, determined experimentally, were cut from the core. This is the minimum thickness at which the firn does not break apart and individual particles do not fall out. As a rule, to increase the strength properties of firn and produce finer thin sections, the sample is infiltrated with a hydrophobic liquid, and the thin section is made after its solidification and subsequent sublimation [35, 36]. The problem with this method is that the viscous liquid does not penetrate well into small pores, the number of which increases with depth. Because of this, the production of plates for research was limited to surface grinding. Thus, the samples for study can be described as transparent polished thin sections. For further analysis, the obtained thin sections were frozen onto glass. Typically, when studying the microstructure of firn, the description step of the samples spans tens of meters [37, 38]; in this study, thin sections were examined at 5-meter intervals. The main focus in the description was on the size and shape of ice grains, their degree of recrystallization, the nature of their edges, the presence of gas inclusions, and the characteristics of the intergranular and pore spaces. Since the size of the ice grains composing the upper horizons of the SFL is less than 5 mm, for obtaining thinner sections in further studies, the sample is planned to be infiltrated with dimethyl phthalate. This will allow for the production of thinner transparent thin sections to improve the quality of microstructural analysis, study spatial intergranular relationships, and analyze porosity characteristics.
Density measurement
The density of the SFL in the pit was measured with a VS-43 snow gauge. The snow gauge was installed near the upper edge of the pit's working wall and rotated to cover the entire length of the receiving pipe. The snow gauge with the collected sample was then extracted from the wall, and the sample's mass was measured using the device's built-in scale. Next, measurements were taken sequentially for the underlying horizons throughout the pit's depth. The sample mass can be measured with an error of up to ±5 g.
Density research of the SFL based on core material was conducted by measuring the density of each core. Measurements were taken at a depth of 5.5 m due to the high degree of core fragmentation from the overlying horizons. The core's diameter was calculated by averaging three caliper measurements taken at various points along its length. The error in the instrumental measurements, which is directly related to the looseness of the firn that makes up the core, was discovered during previous work at the Vostok Station by Arctic and Antarctic Research Institute employees [23].
Measurement of an ultrasonic wave's propagation velocity
The measurements were taken with the Pulsar-2.2 instrument (NPP Interpribor, Russia). The device measures the travel time of an ultrasonic pulse with a frequency of 60 ± 10 kHz in the test material between the indenter-emitter and the indenter-receiver. The instrumental error of the device is calculated using the following formula
where T is the time of propagation of the ultrasonic wave recorded by the device, ms; k is the coefficient that takes into account the ambient temperature (for the conditions of the Vostok Station, k = 2).
A surface sounding sensor is made up of indenters mounted on a single base and spaced 120 mm apart. Thus, the ultrasound velocity is computed by dividing the distance between the indenters by the measured time. Before beginning work with the device, it was calibrated using the control sample.
In the pit, the speed of ultrasound propagation was measured by inserting a sensor into the pit's working wall with a force of 5-10 kg. The device was set up so that the measurement cycle used to calculate the ultrasound velocity value for the horizon under study consisted of 15 separate velocity measurements, with the arithmetic mean output. The measurements were taken at 25 cm intervals across the pit's entire depth.
Core material measurements were taken at intervals of 0.5 m, corresponding to the drilling run. The sensor was embedded in the center of the run section of the snow-fir core, with the measuring base parallel to the core's axis of symmetry. The force used to insert the sensor and the technique for determining the speed of ultrasound propagation were similar to those used when working in the pit.
Figure 4 depicts the results of measuring the firn density and the velocity of elastic waves that pass through it. These physical characteristics appear to increase with depth. The density of firn deposits measured for the VK-24 borehole is consistent with those obtained for the VK-23 borehole [40] (see Fig.1). The higher strength of the firn from the lower horizons was discovered while manufacturing slides.
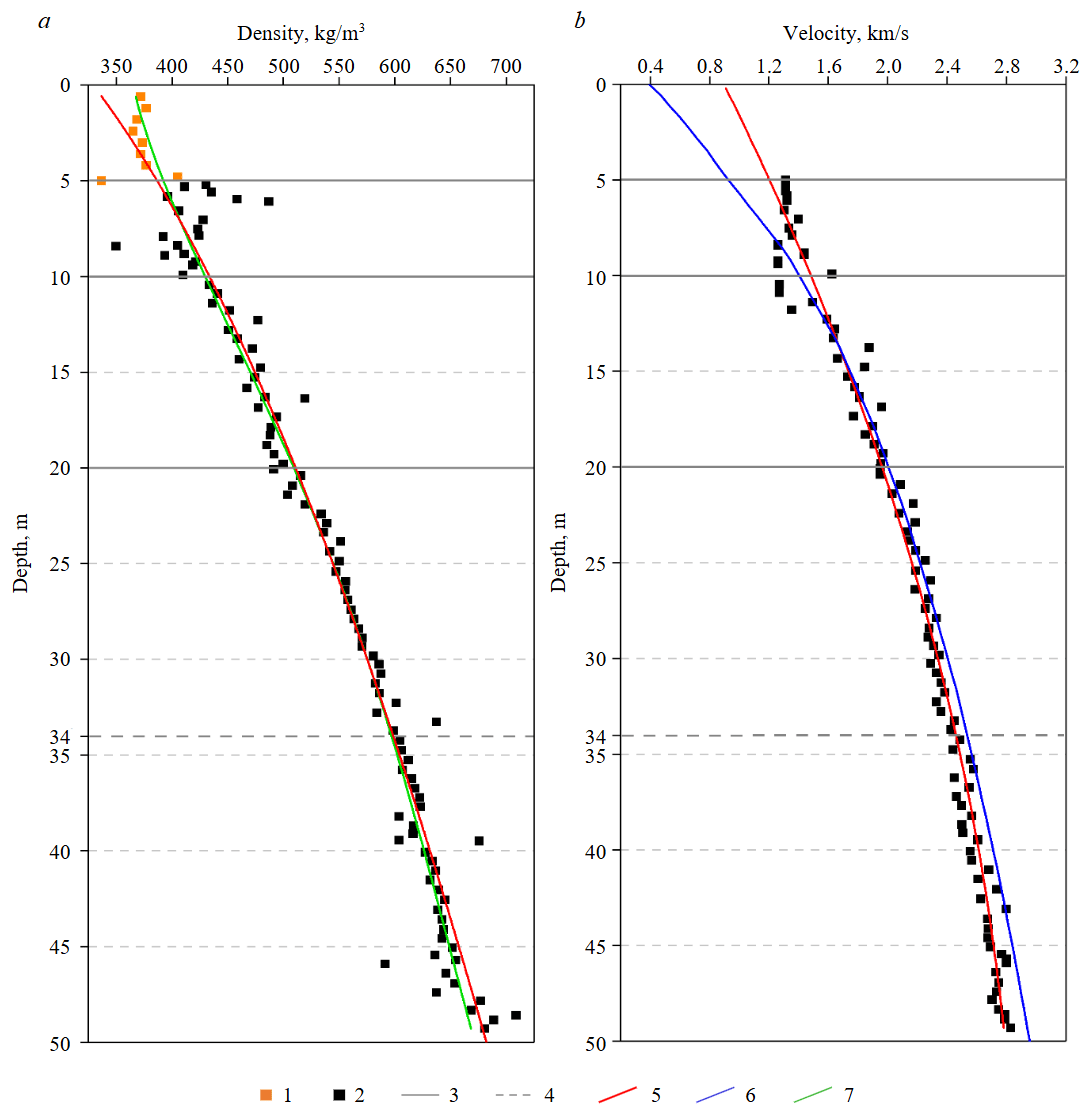
Fig.4. Graphs of the dependence on the depth of the firn density (a), the velocity of propagation of ultrasonic and elastic waves (b)
1 – density measured in the pit; 2 – density and velocity measured by the core; 3 – reliable boundaries between horizons; 4 – assumed boundaries between horizons; 5 – trend lines of ultrasonic wave density and velocity; 6 – velocity of elastic waves obtained from the depth-velocity section; 7 – density trend line according to [23, 39]
Results and discussion
Geophysical research
As an example of seismic survey field results, we present two flank seismograms (Fig.5, a) obtained from the work profile in the Vostok Station area. Tomographic processing yielded a depth-velocity section (Fig.5, b). The results show that the velocity of longitudinal waves increases steadily from 450 to 3,800 m/s, indicating a gradual change in elastic properties with depth. At a depth of 80-90 m, the velocity reaches ice-like values, as confirmed by data on the thickness of the SFL in the Vostok Station area obtained from previous studies [22, 40]. Because of the lack of contrasting properties, it is difficult to identify any boundaries in the studied area; however, the nature of elastic wave velocity distribution will allow the upper part of the section to be properly considered when processing the results of future deep seismic work.
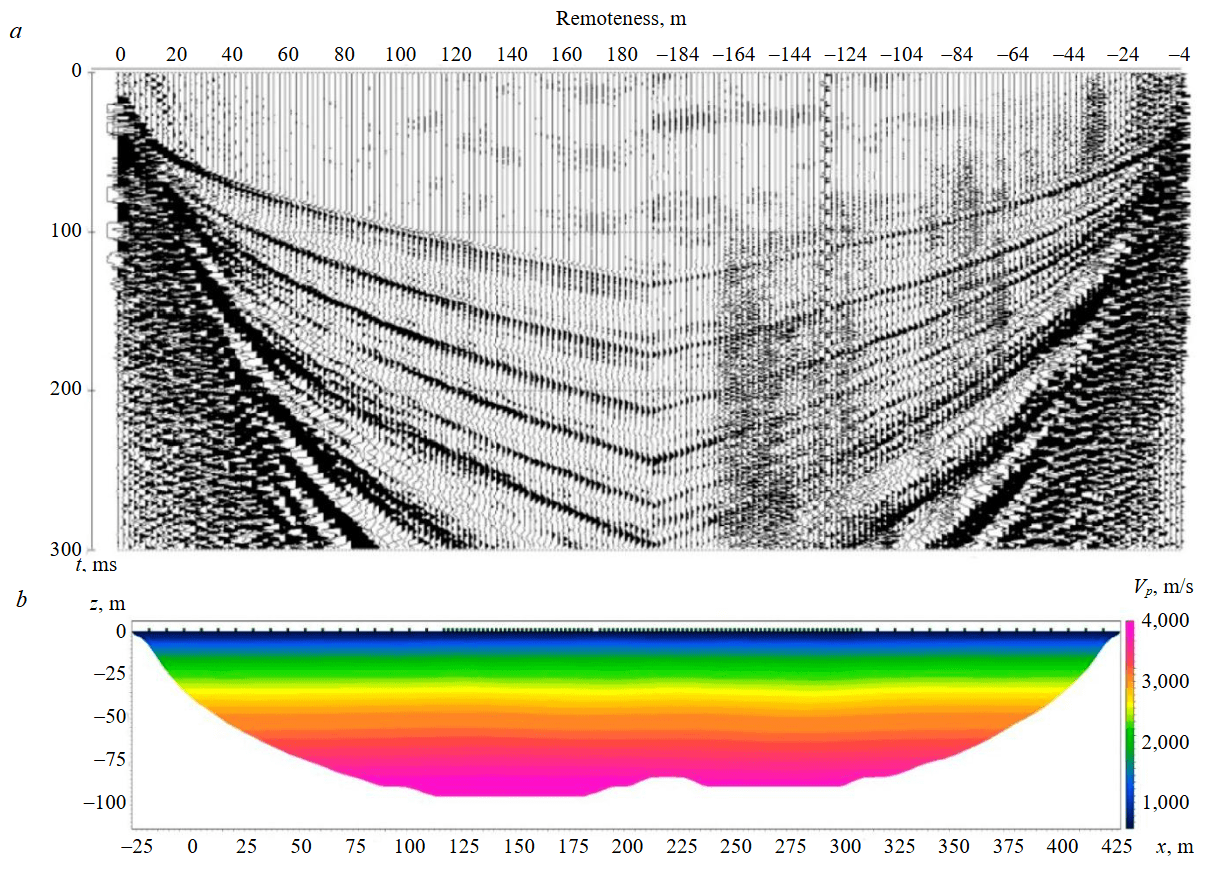
Fig.5. Flanking field seismograms (a) and the result of tomographic processing of field data (b)
Diffracted waves on the georadarogram (Fig.6) highlight reflections from submerged inhomogeneities that, due to their proximity to the runway, are most likely anthropogenic in nature (barrels buried under snow, for example). Using these hyperbolas, the propagation velocity of an electromagnetic wave (17.5 cm/ns) and the medium's dielectric constant (2.93) were calculated. These parameters were used to recalculate the time section into a depth section. The section shows two distinct reflecting horizons (~325 and ~750 ns) that correspond to significant differences in the SFL's physical properties. The signal loses coherence below a depth of 80-90 m, which could indicate a smooth transition from the SFL to ice and is consistent with seismic results.
Microstructure and physical properties of the SFL
The drilling of the borehole took 27 h and 55 min, with 100 drilling trips completed. The borehole depth based on the core was 49.28 m, with 100 % core recovery from a depth of 5.5 m. Excavation of the pit took 8 h, with its dimensions measuring 5×5×5.5 m.
The study of the microstructure of firn was conducted on 10 core samples at 5 m intervals (Fig.7).
The obtained results show that with depth, the size of ice grains in firn deposits increases from fractions of a millimeter to monocrystals up to 5 mm in size. Along with this, thin sections show an increase in the percentage of larger grain fractions, which may be due to recrystallization processes under directed stress and over time [41], resulting from paratectonic regelation recrystallization [42]. For example, in the thin section at a depth of 5.5 m, the void space between isometric crystals (1-1.5 mm in size) is filled with small needle- and column-shaped grains, whose length does not exceed 0.2 mm (Fig.6). These grains composes up to 50 % of the total rock volume. With increasing depth, their amount gradually decreases, barely reaching 10 %, and at depths over 40 m, they coalesce, resulting in a more homogeneous firn structure.

Fig.6. Georadarogram of the area of the Vostok Station with the Triton antenna unit
1, 2 – reflecting horizons; 3 – straight wave
Based on the studied microstructural features and physical properties of the SFL, the stratigraphic section of the near-surface part of the Antarctic Ice Sheet in the Vostok Station area has been classified. Five horizons have been identified at depth intervals of 0-5, 5-10, 10-20, 20-34(?), and 34(?)-50 m. The boundaries between these horizons exhibit gradual transitions, which is reflected in the results of seismic studies (see Fig.4, b, 5, b). Let us examine each of the identified horizons (depth intervals based on the core).
- Interval 0-5 m. Loose snow-firn formations with layers of dense radiation crusts, which were studied in the VK-24 pit. The average density of this horizon is 375 kg/m3, with values exceeding 400 kg/m3 at the lower boundary (see Fig.4, a). The velocity of ultrasonic wave propagation in this interval increases slightly at depths of 0-2 m, then remains nearly constant, averaging 1,300 m/s. After processing the results of seismic and ultrasonic studies, it was found that the velocity values obtained from the latter were significantly higher. This may be due to the fact that the Pulsar 2.2 device used for measurements does not allow for the measurement of velocities below 1,000 m/s, as the signal passing between the indenters short-circuits through the instrument's handle. The lack of valid velocity measurements in this interval is likely the reason for the overestimation of the trend line values compared to seismic survey results (see Fig.4, b).
The lower boundary is set at a depth of 5 m, based on a sudden increase in density and the recovery of a harder core from the underlying intervals. In the 0-5 m interval, the core was extracted in fragments, whereas from 5.5 m and deeper, it was recovered intact. The thickness of this horizon is approximately 5 m.
- Interval 5-10 m. According to the analysis of microstructural features, this horizon consists of fine-grained firn, composed of grains of different sizes, which can be conditionally divided into two groups. The majority of the rock (60 % of the total volume) is composed of angular and slightly rounded grains of isometric or tabular shape, with an average size of 1-1.5 mm (Fig.7). The second group consists of needle- and column-shaped grains, up to 0.2 mm in elongated cross-section, which fill the voids between the larger grains. The core from the upper part of this horizon (5-6 m interval) was recovered in fragments. Some pieces, less than 10 cm in size, often had irregular shapes, complicating the measurement of their diameter and length, which resulted in anomalously high density values at the upper boundary. However, the average density of the fine-grained firn is 425 kg/m3, with an average ultrasonic wave velocity of 1,350 m/s. The lower boundary of the horizon can be set at a depth of 10-12 m, based on the analysis of physical properties. As mentioned earlier, the transition between cryological differences is gradual and smooth. At the same time, the study of the core from the neighboring VK-23 borehole [40] indicates that the base of this horizon can be set at 10 m, based on the presence of grain aggregates up to 5 mm in size in thin sections of the underlying deposits, which were not previously observed. Similar aggregates were noted in VK-24 at depths of 15 m and below (Fig.7). The thickness of the horizon is approximately 5 m.
- Interval 10-20 m. The fine- to medium-grained firn consists of a heterogeneous mass composed of grains from two groups. The first group consists of isometric or tabular grains with an average size of 1.2 mm, making up 60 % of the total rock volume. Additionally, fused aggregates ranging from 2-2.5 mm to 5 mm account for 30 % of the mass, forming tight intergrowths and aggregates. The intergranular space is filled with small elongated grains (up to 1 mm). The largest aggregates contain gas inclusions. The density of the firn increases from 440 to 500 kg/m3 near the lower boundary of the horizon. The elastic wave velocity graph (see Fig.2) shows an increase in gradient, with values reaching 2,000 m/s at the lower boundary. This suggests a sharp reduction in open pore area and a denser packing of crystals. The lower boundary is defined by the presence of blastesis structures in the underlying horizons and changes in physical properties. The thickness of the horizon is approximately 10 m.
- Interval 20-34 m. The medium-grained firn consists of a heterogeneous mass composed of grains of varying sizes. More than 70 % of the rock consists of well-recrystallized idiomorphic isometric grains with an average size of 3-3.5 mm. The grain boundaries are poorly distinguishable, so the largest grains (5-6 mm) may actually be aggregates forming blast structures resembling honeycombs. The second group consists of ~1 mm grains, which are significantly less recrystallized with irregular grain boundaries. Elongated crystals are also present, filling intergranular spaces (up to 10 % of the total rock volume), with lengths of 0.5 mm. This horizon shows a steady and uniform increase in density and ultrasonic wave velocity, reaching 500-600 kg/m3 and 2,000-2,500 m/s, respectively. The thickness of the horizon is approximately 14 m.
- Interval 34-50 m. At a depth of 34 m, the lower boundary of the medium-grained firn is conditionally defined. This is due to the fact that from 35 m, grains larger than 4 mm begin to dominate the rock. An increase in firn strength characteristics is observed, making it less susceptible to grinding. When polishing a plate cut from the core, it became covered in fine dust, which significantly reduced the transparency of the thin section (Fig.7). The density and ultrasonic wave velocity from a depth of 34 m exceed 600 kg/m3 and 2,500 m/s, respectively. Thus, this interval consists of medium-grained firn with two grain fractions: the first fraction includes idiomorphic isometric and tabular crystals 4 mm and larger; the second fraction consists of irregularly shaped xenomorphic aggregates with uneven and intricately curved boundaries, formed from elongated crystals that previously filled the intergranular space in the overlying intervals.
The generalized characteristics of each identified depth interval are presented in the Table.
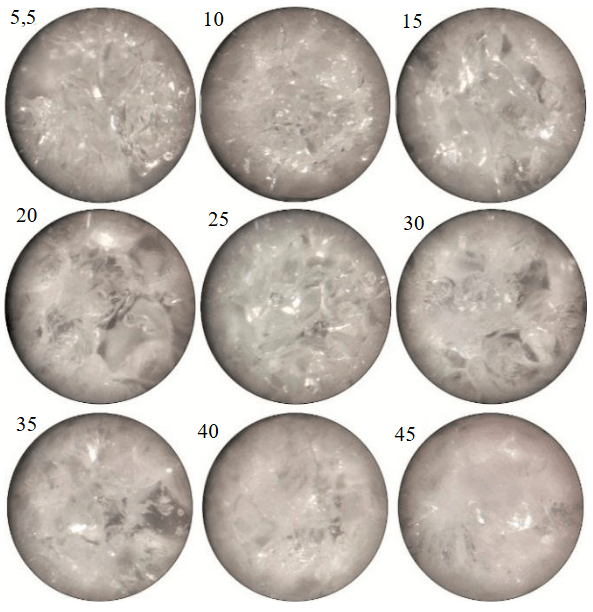
Fig.7. Microphotographs of firn deposits recovered from borehole VK-24. The numbers indicate the depth in meters. The field of view is 10 mm
It is worth noting the good agreement between the results of core studies and geophysical data, particularly seismic data. The obtained stratigraphic section (structural and material composition of the identified SFL horizons, their boundaries) shows significant correlation with the section from well VK-23, located 1.5 km away (see Fig.1) [40]. The calculated density of snow-firn deposits also closely matches the results of previous studies [23, 39] (see Fig.4, a). The density characteristics provided for the horizons identified through microstructural analysis are consistent, with particularly reliable agreement observed for the data obtained from core samples.
A refined schematic stratigraphic section of the near-surface part of the Antarctic ice sheet in the vicinity of Vostok Station
|
Depth, m |
Lithological Column |
Thickness, m |
Characteristics of subdivisions |
|
5 |
|
5 |
Loose snow-firn deposits with Interlayers of dense radiation crusts
|
|
10 |
|
5 |
Fine-grained firn composed of isometric (1-1.5 mm) and needle-shaped (up to 0.2 mm) grains filling voids |
|
15 |
|
10 |
Fine- to medium-grained firn composed of a heterogeneous mass. The majority of the material consists of isometric grains (1.2 mm) and aggregates (up to 5 mm). The second group includes elongated individuals (up to 1 mm)
|
|
20
30 |
|
14? |
Medium-grained firn composed of idiomorphic isometric grains forming a blastesa structure (3-6 mm) and small grains (1 mm) |
|
40
50 |
|
>16 |
Medium- to coarse-grained firn composed of individuals larger than 4 mm |


When comparing the obtained results with known data, it is noted differences in the values related to the snow-firn boundary, which was previously identified at a depth of 22.7 m. The set of characteristic structural features in the upper part of the snow-firn thickness (SFL) (5-20 m), identified in this study-particularly the presence of isometric grains, porous granoblastic structures, and interstitial air inclusions, as well as measured density values ranging from 0.49 to 0.80 g/cm3 allows us to classify these formations as firn [42]. This is further supported by the section from well VK-23 [40]. At the same time, the previously identified boundary at a depth of 22.7 m [10, 23, 39], determined experimentally, is proposed to be reconsidered as a transition zone from fine-grained firn to medium-grained firn. To confirm this hypothesis, a more detailed microstructural analysis is planned, with a reduction in the core description interval to 0.5 m.
Conclusion
In the near-surface part of the Antarctic ice sheet section near the Vostok Station, five SFL horizons are distinguished by different microstructural features and physical properties. The position of geological boundaries at depths of 5; 10; 20; and 34 m is partially confirmed by seismic and ground-penetrating radar surveys (for the 34 m boundary), with changes in the gradient of elastic wave velocity observed at the specified intervals. The ABDL – Triton cannot distinguish boundaries at depths of 5; 10; or 20 m, and higher frequency antennas are required for accurate representation.
The current data on the structure of the SFL near the Vostok Station will be used to plan and develop methods and techniques for drilling operations during deep seismic studies aimed at examining the glacier's lower horizons, as well as the thickness, morphology, and composition of Lake Vostok bottom sediments to select the drilling site. Studying Lake Vostok consolidated foundation and learning about its structural features will allow us to determine the geodynamic conditions that led to its formation [43].
The studies on determining the speed of ultrasound passing through core material showed good agreement with the results of seismic exploration work at a depth of 5 m. The discrepancy in measurement results in the SFL's near-surface region is due to its physical properties and the Pulsar 2.2 device's design. The upper horizons of the SFL are distinguished by lower density, greater brittleness, and a greater volume of open pores, which have a greater influence on the speed measurements on the core after mechanical impact on the rocks during drilling than measurements on samples from lower horizons. Local core deformations may occur during indenter insertion, affecting measurement results negatively. Future studies of this type intend to increase the number of measurements within a single interval. The obtained results will be used to study the physicomechanical properties of the glacier based on core material using non-destructive methods.
The microstructural features of the SFL structure based on core material are analyzed by infiltrating the section with a liquid, such as dimethyl phthalate, which is then solidified and sublimated. This will allow for the creation of thinner and more transparent sections without compromising the sample's integrity, allowing for the assessment of porosity in the SFL and improving microstructural analysis results.
References
- Popov S.V. Six decades of radar and seismic research in Antarctica. Ice and Snow. 2021. Vol. 61. N 4, p. 587-619 (in Russian). DOI: 10.31857/S2076673421040110
- Morlighem M., Rignot E., Binder T. et al. Deep glacial troughs and stabilizing ridges unveiled beneath the margins of the Antarctic ice sheet. Nature Geoscience. 2020. Vol. 13. N 2, p. 132-137. DOI: 10.1038/s41561-019-0510-8
- Livingstone S.J., Yan Li, Rutishauser A. et al. Subglacial lakes and their changing role in a warming climate. Nature Reviews Earth & Environment. 2022. Vol. 3. N 2, p. 106-124. DOI: 10.1038/s43017-021-00246-9
- Frémand A.C., Fretwell P., Bodart J.A. et al. Antarctic Bedmap data: Findable, Accessible, Interoperable, and Reusable (FAIR) sharing of 60 years of ice bed, surface, and thickness data. Earth System Science Data. 2023. Vol. 15. Iss. 7, p. 2695-2710. DOI: 10.5194/essd-15-2695-2023
- Popov S.V., Chernoglazov J.B. Subglacial lake Vostok, East Antarctica: a coastal line and surrounding water bodies. Ice and Snow. 2011. N1 (113), p. 13-24 (in Russian).
- Popov S.V., Masolov V.N., Lukin V.V., Popkov A.M. National seismic, radar and seismological studies of subglacial lake Vostok. Ice and Snow. 2012. Vol. 52. N 4, p. 31-38 (in Russian). DOI: 10.15356/2076-6734-2012-4-31-38
- Litvinenko V.S., Leitchenkov G.L., Vasiliev N.I. Anticipated sub-bottom geology of Lake Vostok and technological approaches considered for sampling. Geochemistry. 2020. Vol. 80. Iss. 3. N 125556. DOI: 10.1016/j.chemer.2019.125556
- Serbin D.V., Dmitriev A.N. Experimental research on the thermal method of drilling by melting the well in ice mass with simultaneous controlled expansion of its diameter. Journal of Mining Institute. 2022. Vol. 257, p. 833-842. DOI: 10.31897/PMI.2022.82
- Litvinenko V. Foreword: Sixty-year Russian history of Antarctic sub-glacial lake exploration and Arctic natural resource development. Geochemistry. 2020. Vol. 80. Iss. 3. N 125652. DOI: 10.1016/j.chemer.2020.125652
- Salamatin A.N., Lipenkov V.Ya., Barnola J.M. et al. Snow/Firn Densification in Polar Ice Sheets. Low Temperature Science. 2009. Vol. 68 (Suppl. Iss.), p. 195-222.
- Salamatin A.N., Lipenkov V.Ya., Barnola J.M. et al. Basic approaches to dry snow-firn densification modeling. Data of Glaciological Studies. 2006. Iss. 101, p. 3-16.
- Salamatin A.N., Lipenkov V.Ya. Simple relations for the close-off depth and age in dry-snow densification. Annals of Glaciology. 2008. Vol. 49, p. 71-76. DOI: 10.3189/172756408787814889
- Gascon G., Sharp M., Burgess D. et al. How well is firn densification represented by a physically based multilayer model? Model evaluation for Devon Ice Cap, Nunavut, Canada. Journal of Glaciology. 2014. Vol. 60. N 222, p. 694-704. DOI: 10.3189/2014JoG13J209
- Alley R.B. Firn densification by grain-boundary sliding: a first model. Journal de Physique Colloques. 1987. Vol. 48. N C1, p. 249-254. DOI: 10.1051/jphyscol:1987135
- Alley R.B. Flow-law hypotheses for ice-sheet modeling. Journal of Glaciology. 1992. Vol. 38. N 129, p. 245-256. DOI: 10.3189/S0022143000003658
- Davis R.E., Arons E.M., Albert M.R. Metamorphism of Polar Firn: Significance of Microstructure in Energy, Mass and Chemical Species Transfer. Chemical Exchange Between the Atmosphere and Polar Snow. Springer, 1996. Vol. 43, p. 379-401. DOI: 10.1007/978-3-642-61171-1_17
- Alley R.B., Woods G.A. Impurity influence on normal grain growth in the GISP2 ice core, Greenland. Journal of Glaciology. 1996. Vol. 42. N 141, p. 255-260. DOI: 10.3189/S0022143000004111
- Cuffey K.M., Thorsteinsson T., Waddington E.D. A renewed argument for crystal size control of ice sheet strain rates. Journal of Geophysical Research: Solid Earth. 2000. Vol. 105. N B12, p. 27889-27894. DOI: 10.1029/2000JB900270
- Serbin D.V., Dmitriev A.N., Vasiliev N.I. Device for fusion drilling with simultaneous or follow-up reaming of wells in ice. Earth sciences and subsoil use. 2021. Vol. 44. N 3, p. 333-343 (in Russian). DOI: 10.21285/2686-9993-2021-44-3-333-343
- Serbin D.V. Prevention of emulsion formation during opening subglasial reservoirs. News of the Ural State Mining University. 2021. Iss. 3 (63), p. 80-88 (in Russian). DOI: 10.21440/2307-2091-2021-3-80-88
- Kadochnikov V.G., Dvoynikov M.V. Development of Technology for Hydromechanical Breakdown of Mud Plugs and Improvement of Well Cleaning by Controlled Buckling of the Drill String. Applied Science. 2022. Vol. 12. Iss. 13. N 6460. DOI: 10.3390/app12136460
- Veres A.N., Ekaykin A.A., Golobokova L.P. et al. A record of volcanic eruptions over the past 2,200 years from Vostok firn cores, central East Antarctica. Frontiers in Earth Science. 2023. Vol. 11. N 1075739. DOI: 10.3389/feart.2023.1075739
- Ekaykin A.A., Tchikhatchev K.B., Veres A.N. et al. Vertical profile of snow-firn density in the vicinity of Vostok station, Central Antarctica. Ice and Snow. 2022. Vol. 62. N 4, p. 504-511 (in Russian) DOI: 10.31857/S2076673422040147
- Veres A.N., Ekaykin A.A., Lipenkov V.Ya. et al. First data on the climate variability in the vicinity of Vostok Station (central Аntarctica) over the past 2,000 years based on the study of a snow-firn core. Arctic and Antarctic Research. 2020. Vol. 66. N 4, p. 482-500 (in Russian). DOI: 10.30758/0555-2648-2020-66-4-482-500
- Pashchenko F.A., Kharkov N.S., Sidorenko A.A., Garbuzov V.V. Compaction of the snow base of Vostok station wintering complex. Structural Mechanics of Engineering Constructions and Buildings. 2023. Vol. 19. N 3, p. 285-301 (in Russian). DOI: 10.22363/1815-5235-2023-19-3-285-301
- Banfi F., De Michele C. A local model of snow–firn dynamics and application to the Colle Gnifetti site. The Cryosphere. 2022. Vol. 16. Iss. 3, p. 1031-1056. DOI: 10.5194/tc-16-1031-2022
- Sayers C.M. Porosity dependence of elastic moduli of snow and firn. Journal of Glaciology. 2021. Vol. 67. N 265, p. 788-796. DOI: 10.1017/jog.2021.25
- Thomas E.R., Vladimirova D.O., Tetzner D.R. et al. Ice core chemistry database: an Antarctic compilation of sodium and sulfate records spanning the past 2000 years. Earth System Science Data. 2022. Vol. 15. Iss. 6, p. 2517-2532. DOI: 10.5194/essd-15-2517-2023
- Steig E.J., Fischer H., Fisher D. et al. White paper: The IPICS 2k Array: a network of ice core climate and climate forcing records for the last two millennia. International Partnerships in Ice Core Sciences. 2006, p. 4.
- Kohnen H. On the Relation between Seismic Velocities and Density in Firn and Ice. Zeitschrift für Geophysik. 1972. Band 38. Heft 1, p. 925-935.
- Picotti S., Carcione J.M., Pavan M. Seismic attenuation in Antarctic firn. The Cryosphere. 2024. Vol. 18. Iss. 1, p. 169-186. DOI: 10.5194/tc-18-169-2024
- Masolov V.N., Sheremetiev A.N., Popov S.V., Lukin V.V. Geophysical investigations of the subglacial Lake Vostok in Eastern Antarctica. Doklady Akademii nauk. 2001. Vol. 379. N 5, p. 680-685 (in Russian).
- Gillet F., Donnou D., Girard C. et al. Ice core quality in electromechanical drilling. Proceedings of the Second International Workshop/Symposium on Ice Drilling Technology, 30-31 August 1982, Calgary, AB, Canada. Hanover: Cold Regions Research and Engineering Laboratory, 1984. CRREL Special Report 84-34, p. 73-80.
- Sirotkin A.N., Talovina I.V., Duryagina A.M. Mineralogy and geochemistry of alkaline lamprophyres of north-western Spitsbergen (Svalbard). Geochemistry. 2020. Vol. 80. Iss. 3. N 125508. DOI: 10.1016/j.chemer.2019.04.004
- Iliescu D., Baker I., Hui Chang. Determining the orientations of ice crystals using electron backscatter patterns. Microscopy Research and Technique. 2004. Vol. 63. Iss. 4, p. 183-187. DOI: 10.1002/jemt.20029
- Iliescu D., Baker I., Daghlian C.P. Orientation Mapping in Polycrystalline Ice Using Electron Backscatter Patterns. Microscopy and Microanalysis. 2005. Vol. 11. Suppl. 2, p. 1500-1501. DOI: 10.1017/S1431927605505452
- Baker I., Obbard R., Iliescu D., Meese D. Microstructural characterization of firn. Hydrological Processes. 2007. Vol. 21. Iss. 12, p. 1624-1629. DOI: 10.1002/hyp.6725
- Lipenkov V.Ya., Polyakova E.V., Ekaykin A.A. Regularities of congelation ice development in subglacial lake Vostok. Ice and Snow. 2012. Vol. 52. N 4, p. 65-77 (in Russian). DOI: 10.15356/2076-6734-2012-4-65-77
- Lipenkov V.Ya., Salamatin A.N., Duval P. Bubbly-ice densification in ice sheets: II. Applications. Journal of Glaciology. 1997. Vol. 43. N 145, p. 397-407. DOI: 10.3189/S0022143000034973
- Bolshunov A.V., Vasilev D.A., Dmitriev A.N. et al. Results of complex experimental studies at Vostok station in Antarctica. Journal of Mining Institute. 2023. Vol. 263, p. 724-741.
- Abdrakhmanov I.A., Gulbin Y.L., Skublov S.G., Galankina O.L. Mineralogical Constraints on the Pressure-Temperature Evolution of Granulites in the Bunger Hills, East Antarctica. Minerals. 2024. Vol. 14. Iss. 5. N 488. DOI: 10.3390/min14050488
- Shumskii P.A. Basics of Structural Ice Science. Petrofabric of Freshwater Ice as a Method of Glaciological Research. Moscow: Izd-vo Akademii nauk SSSR, 1955, p. 492.
- Litvinenko V., Trushko V. Modelling of geomechanical processes of interaction of the ice cover with subglacial Lake Vostok in Antarctica. Antarctic Science. 2025. Vol. 37, p. 39-48. DOI: 10.1017/S0954102024000506