
PDC cutter pressure on plastic-brittle rock in the process of its destruction
- 1 — Ph.D. Associate Professor Ufa State Petroleum Technological University
- 2 — Ph.D. professor Ufa State Petroleum Technological University

Abstract
Presently, there are no methods for calculating the parameters of the drilling practices with rock-cutting tools equipped with polycrystalline diamond composite (PDC cutters). To create such a method requires the studying their work. The article presents the results of bench studies of the PDC cutters in the process of a rock sample breakdown when reproducing the actual layout of the cutters on the working surface of the bit. An important parameter of PDC cutters operation, which is necessary for the bit load analysis, is the pressure of the cutters on the rock during its breakdown. The total pressure of a cutter on the rock can be broken into two mutually perpendicular components: the forcing pressure and the cutting pressure. It is proposed to evaluate the PDC cutters loading at breakage of rocks of different hardness using relative values of forcing and cutting pressures, which are calculated relative to the yield strength of the rock by the die. It is established that the variability of the average relative pressures of forcing and cutting is significantly influenced by drifting per bit turnover and the radius of the cutter on the bit. The dependences of the maximum relative pressures of PDC cutters at the plastic-brittle rock breakdown on the drifting per bit turnover and the radius of the cutter location on the bit are obtained. It has been established that when drifting up to 0.4 mm per turn, the main mechanism of breakdown is cutting, and with the increase of the breakdown depth, the process of forcing becomes decisive.
None
Introduction. Currently, when drilling oil and gas wells, rock-cutting tools of cutting and chipping action equipped with polycrystalline diamond composite cutters (PDC cutters) are widely used [6, 9, 10]. The efficiency of rock breakdown with PDC bits and the efficiency of the entire drilling process depends on both the design of the bits and parameters of drilling practices. To date, there is no clear methodology for calculating the parameters of the drilling practices with these tools.
In the process of drilling, there is a load on the bit that is distributed unevenly between individual cutters, depending on the design of the bit and the mechanical properties of the rock, so the development of such a technique can be based on analytical studies of the cutters work at rock breakdown or on experimental studies, both field and bench. In [1, 13] пthe results of modeling the interaction of cutters with rock mass in a specialized software package are presented to optimize the location of cutters on the working surface of the bit; however, there is no description of the mathematical methods underlying the modeling. In the works of K.I.Borisov, V.V.Neskoromnykh, V.L.Rubtsov [2-5, 8] a description of the results of the study of cutter performance in the process of rock breakdown is given on the basis of experimental study of single cutter performance, with the cutter itself being stationary and the rock sample rotating, which does not fully correspond to the real dynamics of the cutters work in the bottom. In [14-18] the results of research into the power and energy loading of the PDC cutter are described. The main drawback of these works is that the interaction of a single cutter with the rock is studied, whereas in reality, the performance of each cutter is influenced by the profile of the bottom, which is formed by cutters that affect neighboring areas.
As a result of uneven load distribution, heavy wear and tear of individual cutters or their breakage occur, so the most informative are bench studies which to a large extent reproduce the process of rock breakdown in the real scheme of placing cutters on the working surface of the PDC bit. In the article, the results of bench studies [7, 11, 12], The rock sample is mounted in a special holder on the desktop of the drilling machine. The design of the actuation component of the stand allows to reproduce the required section of the PDC bit profile, i.e., set the necessary parameters for placing the cutters relative to each other and the bit axis.
Methodology. To assess the loading of individual cutters, the argument was taken as drifting for one turnover of the bit, and the forces acting on the cutter were recorded. The research was carried out on a specially designed stand, which is a floor drilling machine equipped with an electronic recording unit, an actuation component with three PDC cutters installed on it, and a cutter area wash system [12]. The rock sample is mounted in a special holder on the desktop of the drilling machine. The design of the actuation component of the stand allows to reproduce the required section of the PDC bit profile, i.e., set the necessary parameters for placing the cutters relative to each other and the bit axis [11, 12].
The middle of the three PDC cutters in the actuation component is the main one and the other two are auxiliary. The main cutter is mounted in a special strain gauge rack that allows to measure three components of the load on the cutter: axial Fg, circumferential Ft and radial Fr forces.
Before starting the experiment, the following parameters are set: the location of cutters, the angle of their installation, the rotation frequency of the actuation component, and the longitudinal feed of the drill rod in one of its turns (drifting per one turnover of the cutters). In the course of the experiment, the results of the measurement of the load on the cutter are automatically recorded in digital form in its own non-volatile memory of the electronic block of the stand and after the experiment is completed, they are saved on the computer’s hard disk.
All experiments were carried out on a sample of medium-hard marble rock, which has the following indicators of mechanical properties determined by the method of static indentation on the stamp: die hardness рsh = 950 MPa; yield strength р0 = 650 MPa; conditional plasticity factor К = 1,7-2; energy intensity of breakdown Av = 110 J/sm3. The work of 13.5 mm PDC cutters with sharp edge and chamfer was studied. The following parameters of the location of the main and auxiliary cutters were selected for the experiment (Fig.1): offset of the auxiliary cutters X1 = 8 mm, X2 = 8 mm; difference in heights of the auxiliary cutters Z1 = 3,7 mm, Z2 = 2,8 mm; main cutter radius R = 25; 50; 85 mm; cutter installation angle α = 20°.

Drifting δ per one cutter turnover was set at six levels: δ = 0,28, 0,4, 0,56, 0,8, 1,12, 1,6 mm at a speed of 90 min–1. The cutting zones of the main and auxiliary cutters were washed by the technical water jets.
Discussion. Based on the results of the experiments, the following ranges of load changes were obtained:
• The cutter with sharp edge: the average axial force Fg = 328-1427 N; maximum axial force Fgmax = 472-1970 N; average circumferential force Ft = 315-1388 N; maximum circumferential force Ftmax = 519-2296 N;
• The cutter with chamfer: the average axial force Fg = 744-2745 N; maximum axial force Fgmax = 1124-4175 N; average circumferential force Ft = 534-1617 N; maximum circumferential force Ftmax = 853-2739 N.
An important parameter of the PDC cutter operation for calculating bit loads is the pressure of the bit cutters on the rock mass. Total incisor pressure on the rock mass vector р s directed perpendicular to the working surface of the cutter, and can be split into two mutually perpendicular directions; at that
where pg is the absolute value of the forcing pressure created by the axial force Fg on the horizontal projection Sg of the contact surface of the cutter perpendicular to the axis of rotation, i.e. pg = Fg/Sg assuming that distribution of pressure over the contact area is uniform; pt is the cutting pressure created by the circumferential force Ft on the vertical projection St of the cutter contact surface perpendicular to this force, thus pt=Ft/St.
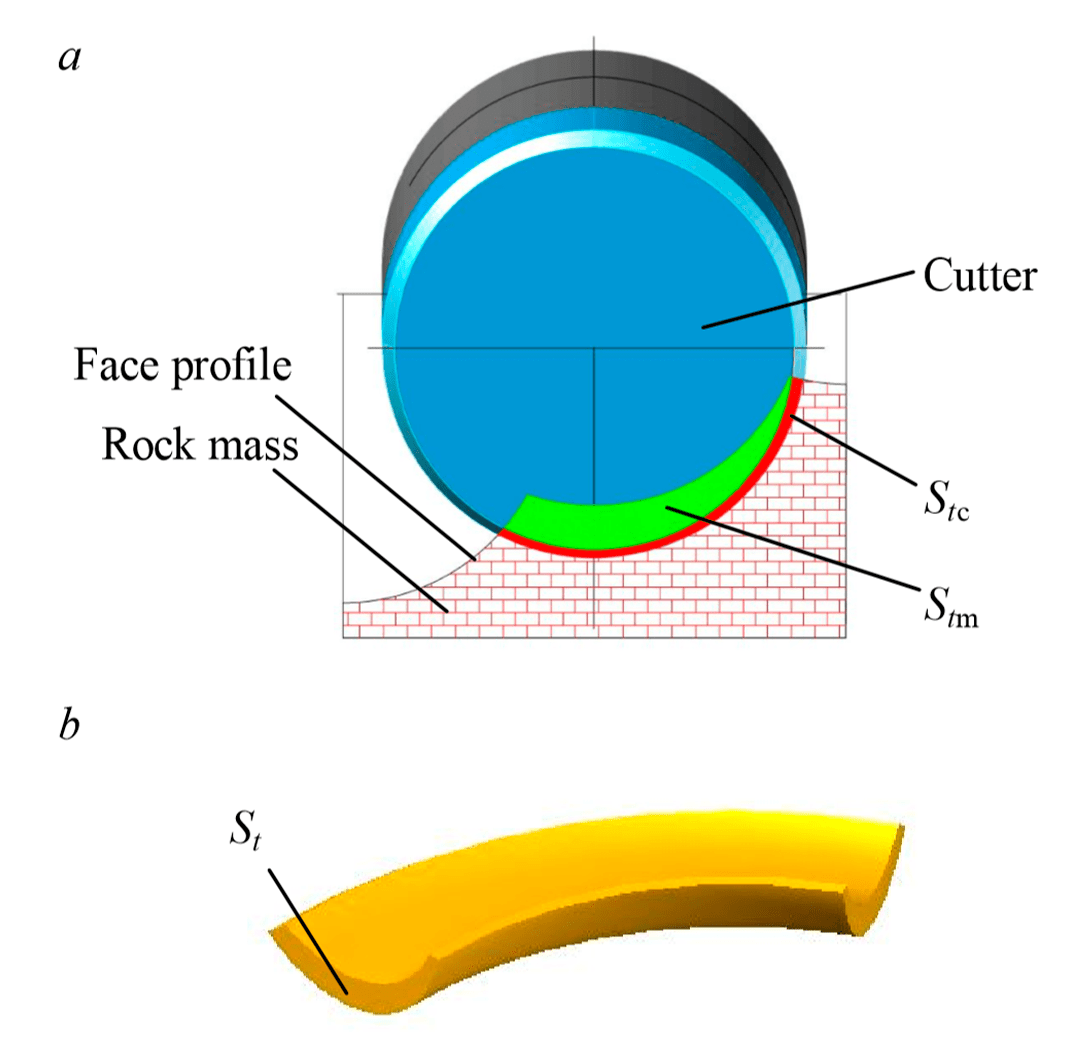
Figure 2 shows the profile of a chamfered cutter tunneling in a single turnover δ.
The main working surface of the cutter is inclined towards the axis of rotation at an angle α (the angle of installation of the cutter α=20°), the chamfer surface is inclined at an angle β = 65°. For a chamfered cutter, the area St is considered as the sum of the main vertical projection Stm and the vertical projection of the chamfer Stc
$$S = S_{t\mathrm{r}}+S_{{t}\mathrm{c}}, \tag*{(1)}$$and the horizontal projection is:
$$S = S_{g\mathrm{r}}+S_{{g}\mathrm{c}}, \tag*{(2)}$$where Stm and Stc are projections of the main surface of the cutter and the chamfer, respectively, onto the horizontal plane (the face plane).

From Fig.2 the following relations are drawn:
$$S_{g\mathrm{r}} = S_{t\mathrm{r}}\mathrm{tg\alpha}, \quad S_{g\mathrm{c}} = S_{t\mathrm{c}}\mathrm{tg\beta}. \qquad \tag*{(3)}$$Calculation of the contact area St of the cutter with the rock mass at a given drifting δ for one of its turnover is carried out in the AutoCAD automated design system (Fig.3).
The projection of the cutter contour on the vertical plane is an ellipse with the major axis d and the minor axis dCosα, located vertically. Since St lies in the plane passing through the radius R and the axis of rotation (vertical plane), projections of the contours of the main and auxiliary cutters were plotted in this plane in two positions: for one drifting and for the subsequent ones offset by d. Thus, the profile of the face and projections of the contact areas Stm and Stc, were obtained, which were measured using AutoCAD.
The mechanisms of deformation and rock breakdown of various plastic-brittle rocks differ insignificantly. Assessment of the loading of cutters during the breakdown of rocks of this class with different hardness can be carried out using the relative values of the forcing pressure pgr and cutting ptr, which are calculated relative to the yield strength of the rock by the pr die as follows:
$$p_{g\mathrm{r}} = p_{g}/{p_\mathrm{r}}; \tag*{(4)}$$ $$p_{t\mathrm{r}} = p_{t}/{p_\mathrm{r}}. \tag*{(5)}$$The average forcing pg and cutting pt pressures of the cutter on the rock mass are inversely proportional, respectively, to the horizontal Sg and vertical St projections of the contact cutter area with the rock mass. The contact area depends on the drifting per turnover, for each certain bottomhole coverage scheme.
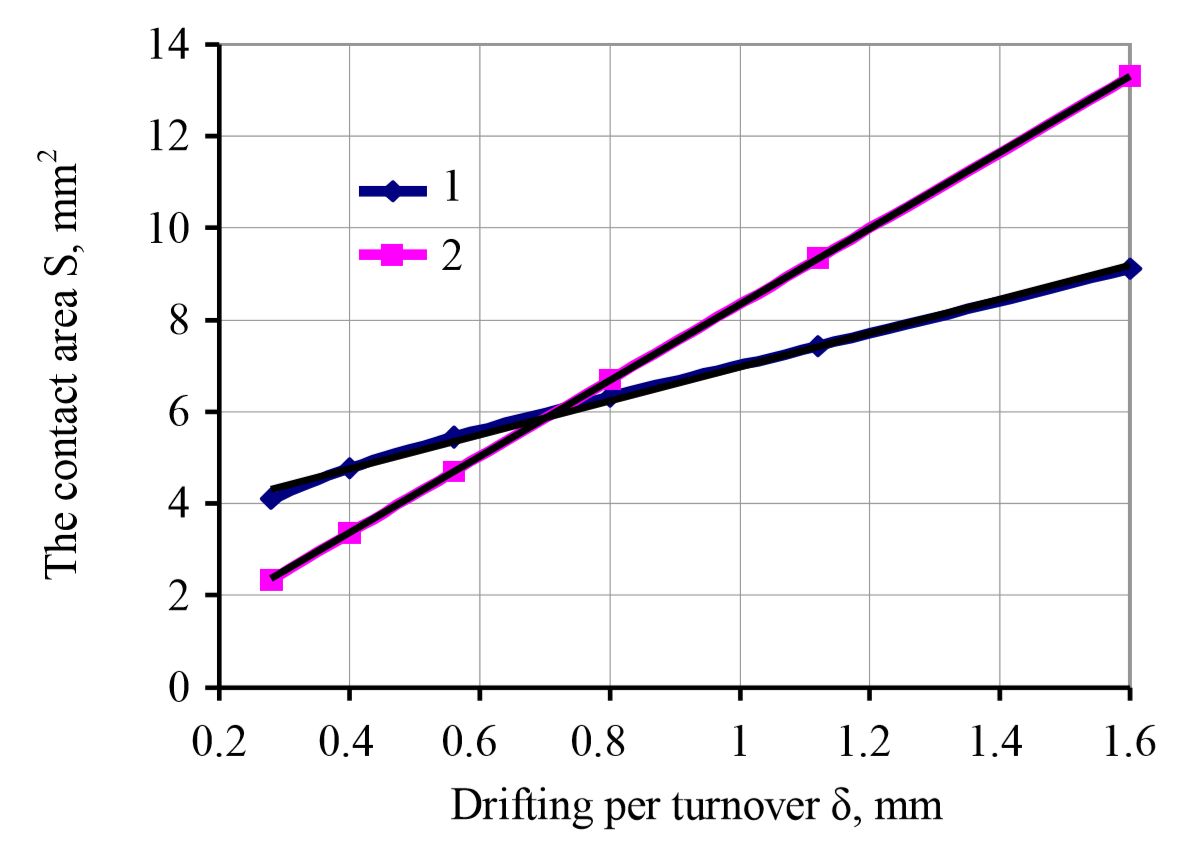
Figure 4 shows graphs of changes of Sg and St on δ for the bottom-hole coverage scheme under consideration for a chamfered cutter. The graphs Sg = ƒ(δ) and St = φ(δ) are approximated by linear dependencies if the approximation confidence value no less than R2 = 0,9962. The growth rate of the vertical projection of the contact cutter area with the rock St is higher than the growth rate of Sg.
Average relative pressures of the PDC cutter on rock for a chamfered cutter are:
| Radius of the cutter location R, mm | Drifting for one turnover δ, mm | Average relative forcing pressure pgr | Average relative cutting pressure ptr | The ratio of average pressure pt/pg |
| 85 | 0,28 | 0,36 | 0,39 | 1,06 |
| 50 | 0,28 | 0,35 | 0,44 | 1,25 |
| 25 | 0,28 | 0,28 | 0,35 | 1,25 |
| 85 | 0,4 | 0,37 | 0,37 | 0,85 |
| 50 | 0,4 | 0,4 | 0,37 | 0,91 |
| 25 | 0,4 | 0,32 | 0,32 | 1,01 |
| 85 | 0,56 | 0,42 | 0,29 | 0,67 |
| 50 | 0,56 | 0,45 | 0,34 | 0,75 |
| 25 | 0,56 | 0,3 | 0,27 | v |
| 85 | 0,8 | 0,52 | 0,26 | 0,5 |
| 50 | 0,8 | 0,53 | 0,29 | 0,55 |
| 25 | 0,8 | 0,47 | 0,28 | 0,6 |
| 85 | 1,12 | 0,44 | 0,21 | 0,47 |
| 50 | 1,12 | 0,45 | 0,22 | 0,49 |
| 25 | 1,12 | 0,45 | 0,21 | 0,5 |
| 85 | 1,6 | 0,46 | 0,18 | 0,38 |
| 50 | 1,6 | 0,46 | 0,19 | 0,4 |
| 25 | 1,6 | 0,45 | 0,19 | 0,41 |
Based on the given initial data, a two-factor dispersion analysis was carried out without repeats at the level of significance a = 0.05 in MS Excel program to establish the essential influence of separate factors, namely the drifting per turnover δ and the radius of the cutter location R on the variability of the average relative pressure of forcing pgr and cutting ptr.
Results of dispersion analysis of the average relative forcing pressure pgr of a chamfered cutter:
| Source of variation | Degree of freedom SS | Sum of squared deviations df | Average square MS | Calculated value of the Fisher ratio ƒ-criterion | Significance level for the calculated ƒ p-value | Table value of the Fisher ratio ƒ-critical |
| Drifting | 0,030237 | 2 | 0,015119 | 44,07 | 0,00001 | 4,10 |
| Radius | 0,057048 | 5 | 0,01141 | 3,33 | 0,00001 | 3,33 |
| Error | 0,003431 | 10 | 0,000343 | |||
| Total: | 0,003431 | 17 |
Fig.4 shows a directly proportional relationship between the drifting per turnover δ and the projections of the contact cutter areas Sg and St. Based on this, it can be argued that the influence of contact area projections on average pressures is statistically significant with a probability of 0.95. Similar results were obtained for a sharp-edged cutter.
Results of dispersion analysis of the average relative cutting pressure ptr of a chamfered cutter are below:
| Source of variation | Degree of freedom SS | Sum of squared deviations df | Average square MS | Calculated value of the Fisher ratio ƒ-criterion | Significance level for the calculated ƒ p-value | Table value of the Fisher ratio ƒ-critical |
| Drifting | 0,005578 | 2 | 0,002789 | 8,95 | 0,00001 | 4,10 |
| Radius | 0,092803 | 5 | 0,018561 | 59,56 | 0,0000004 | 3,33 |
| Error | 0,003116 | 10 | 0,000312 | |||
| Total: | 0,101497 | 17 |
From the results of the analysis, it follows that the influence of drifting per turnover δ and the radius of the cutter location R on pgr and ptr is significant. This statement is based on the fact that the p-value i.e., the significance level for the calculated Fisher ƒ-criterion is less than the specified significance level a = 0.05 in all cases. It means that the calculated values of the Fischer ƒ-criterion are ignificant, and since they are greater than the ƒ-critical, value, the statement about the significant influence of the drifting per turnover and the radius of the cutter is true.
Of certain interest is the comparison of breakdown indicators of plastic-brittle rock by PDC cutters and indicators of its mechanical properties obtained by the standard method of stamp forcing (L.A.Schreiner method). The hardness of the ps by die with the values of the maximum forcing pgmax and cutting ptmax pressures, since at these pressures there is a brittle breakout of plastic-brittle rocks during cutting and forcing. For this comparison, the maximum relative forcing pressures pgrmax and cutting pressures ptrmax were calculated using the following formulas:
$$p_{{g}\mathrm{omax}} = p_{{g}\mathrm{max}}/p_ш;$$ $$p_{{t}\mathrm{omax}} = p_{{t}\mathrm{max}}/p_ш;$$Fig.5 shows the graphs of the dependencies pgmax = ƒ(δ) and ptmax = ƒ(δ) for cutters with sharp edge (а) and with chamfer (б).
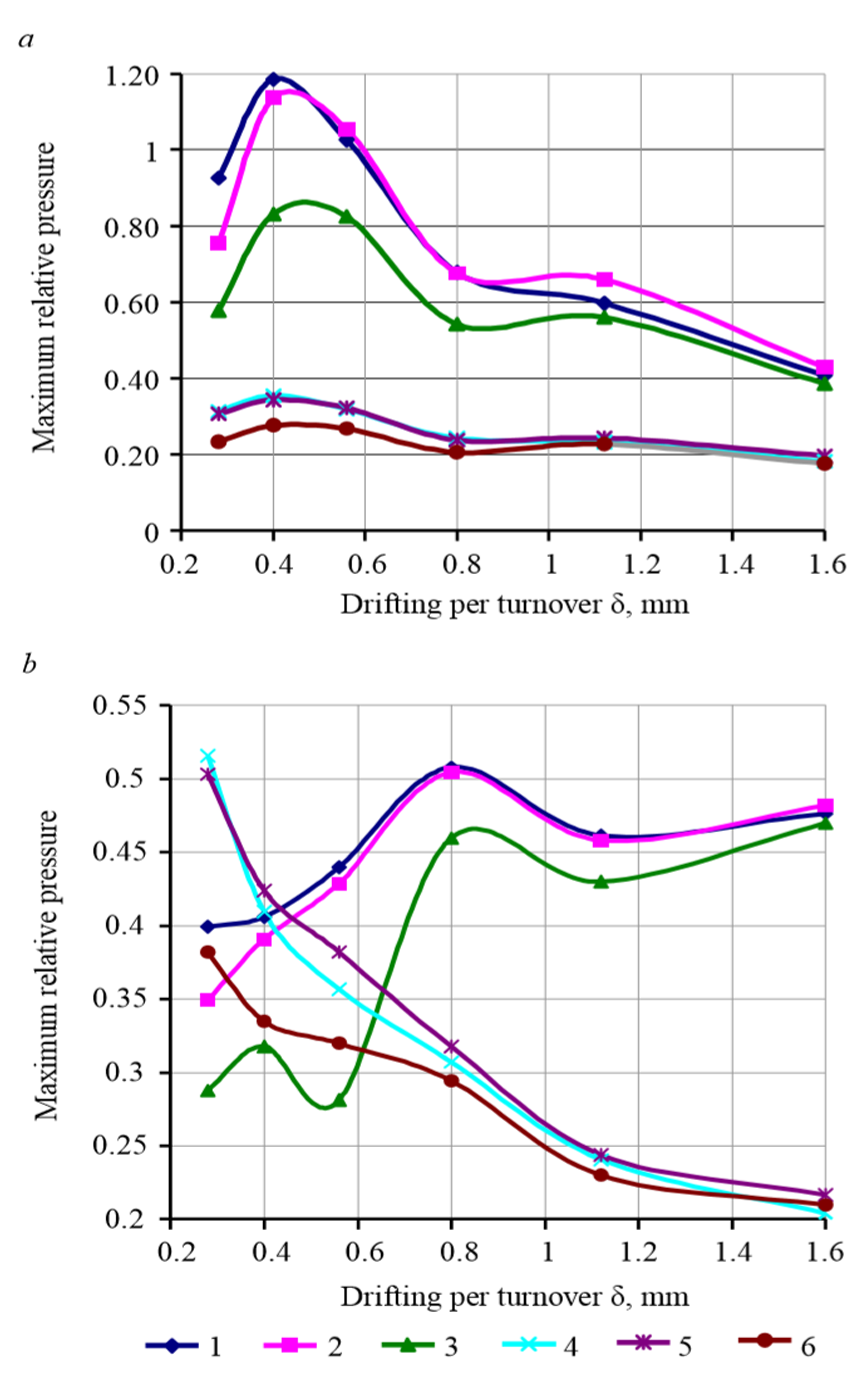
The range of pgrmax for a sharp-edged cutter is very wide-1.2-0.4 (Fig.5, а). When drifting per turnover amounting to 0.28-0.4 mm, the maximum relative forcing pressure increases significantly and reaches its maximum followed by an almost gradual decrease. The relative cutting pressure for a sharp-edged cutter varies in a very narrow range of 0.38-0.2.
The range of change in relative forcing pressure for a chamfered cutter (Fig.5, b) is significantly narrower and lies within the range of 0.28-0.5, while in the range of drifting per turnover of 0.28-0.8 mm it increases, and then slightly decreases. The relative cutting pressure for a chamfered cutter varies in a wide range of 0.5-0.2 at a smooth decrease with increasing drifting per turnover.
Conclusions. The results of experiments to study loading of individual PDC bit cutters at breakdown of a plastic-brittle rock sample by reproducing a section of the bit profile have been considered.
The technique of calculating the forcing and cutting surfaces of cutter for different blade profiles and the values of the corresponding contact pressures is developed. It is proposed to estimate PDC cutters loading with values of average relative (to the yield strength of rock on the die) forcing and cutting pressures and maximum pressures (relative to hardness on the die).
Based on the results of experiments at the level of significance а = 0,05 the statistical significance of the influence of the drifting per turnover and the radius of the cutter location on the average relative forcing and cutting pressures was established.
The obtained values of relative forcing and cutting pressures depending on the drifting per bit turnover can be used to develop a method for calculating axial loads and expected torques on PDC bits when drilling rocks with known mechanical properties determined by the die forcing method.
References
- Ashimov R.R., Shestakov A.N. From the correct placement to a winning combination! Burenie i neft. 2011. N 6, p. 28-29 (in Russian).
- Borisov K.I., Rubtsov V.L. Analytical study of the time strength characteristics of rock mass at cutting and chipping with PDC cutters. Izvestiya Tomskogo politekhnicheskogo universiteta. 2014. Vol. 325. N 1, p. 172-178 (in Russian).
- Borisov K.I. Dynamics of cutter operation in the process of rock breakdown with PDC-type cutting and chipping tools. Izvestiya Tomskogo politekhnicheskogo universiteta. 2010. Vol. 317. N 1, p. 161-164 (in Russian).
- Borisov K.I. Methods of estimation of effectiveness of the dynamic rock’s breakdown process by a cutting and chipping tool. Neftyanoe khozyaistvo. 2008. N 8, p. 46-47 (in Russian).
- Borisov K.I. Experimental quantitative assessment of power characteristics of rock cutting. Izvestiya Tomskogo politekhnicheskogo universiteta. 2002. Vol. 305. N 8, p. 216-219 (in Russian).
- Drilling rock-cutting tool. Vol. 2: Bits with fixed polycrystalline diamond cutters. Ed. by V.Ya.Kershenbauma. Moscow: OOO “Natsionalnyi institut nefti i gaza”, 2011, p. 448 (in Russian).
- Gusev E.A., Trushkin O.B Estimation of power and energy loading of PDC-type bit cutters based on the results of bench drilling. Territoriya Neftegaz. 2013. N 2, p. 34-37 (in Russian).
- Neskoromnykh V.V., Borisov K.I. Analytical study of the process of cutting and chipping rock with PDC cutter bits. Izvestiya Tomskogo politekhnicheskogo universiteta. 2013. Vol. 323. N 1, p. 191-195 (in Russian).
- Besson A., Berr B., Dillard S., Dreik E. et al. A new look at the cutting elements of drill bits. Neftegazovoe obozrenie. 2002. Vol. 7. N 2, p. 4-31 (in Russian).
- Handbook of an oil engineer. Volume II. Drilling engineering. Moscow – Izhevsk: Institut kompyuternykh issledovanii, 2014, p. 1064 (in Russian).
- Trushkin O.B. Rock breakdown by a single PDC cutter. Territoriya Neftegaz. 2016. N 5, p. 16-20 (in Russian).
- Trushkin O.B. Measuring the loading on the PDC cutter during bench drilling. Avtomatizatsiya, telemekhanizatsiya i svyaz v neftyanoi promyshlennosti. 2018. N 3, p. 5-10 (in Russian).
- Sharipov A.N., Mingazov R.R. Bits for drilling on hard rocks. Burenie i neft. 2012. N 12, p. 46-48 (in Russian).
- Sharipov A.N., Khramov D.G., Kovalevskii E.A. Optimization of PDC bit designs aimed at reducing the drilling time of the production string section. Burenie i neft. 2013. N 6, p. 42-44 (in Russian).
- Rafatian N., Miska S.Z., Ledgerwood L.W., Ahmed R., Yu M., Takach N. Experimental Study of MSE of a Single PDC Cutter Interacting With Rock Under Simulated Pressurized Conditions. Society of Petroleum Engineers. 2010. Vol. 25. Iss. 1, p. 10-18. DOI: 10.2118/119302-PA
- Glowka D.A. Development of a Method for Predicting the Performance and Wear of PDC Drill Bits. Sandia Report. SAND86-1745. June 1987.
- Izbinski K., Patel S.G., Van Deven A. Innovative Dual-Chamfer Edge Technology Leads to Performance Gains in PDC Bits. SPE/IADC Drilling conference and Exhibition, 17-19 March, London, England, UK. 2015. DOI: 10.2118/173157-MS
- Rajabov V., Yu M., Miska S., Takach N., Mortimer L. The Effects of Back Rake and Side Rake Angles on Mechanical Specific Energy of Single PDC Cutters with Selected Rocks at Varying Depth of Cuts and Confining Pressures. IADC/SPE Drilling Conference and Exhibition, 6-8 March 2012, San Diego, California, USA. DOI: 10.2118/151406-MS