
On the applicability of electromagnetic monitoring of hydraulic fracturing
- 1 — Head of Division PJSC “Gazprom Neft”
- 2 — Leading Geophysicist Volga Gas plc.
- 3 — Ph.D. Associate Professor Saint Petersburg Mining University

Abstract
The purpose of this work is to assess the possibilities of using electromagnetic monitoring to study the development of a fracture system generated by hydraulic fracturing (HF) with a specified position of the controlled source. The option with the source (a vertical electric dipole) located in the interval of the oil-bearing formation and ground-based measurements was chosen as the most promising monitoring plan. We have built a geoelectric model equivalent to the system of hydraulic fractures, divided into 11 zones corresponding to HF stages. For the selected model, mathematical simulation was performed by solving the direct problem considering the impact of the steel casing, the presence of which reduced the effect. Despite this fact, no strong distortion of electromagnetic field anomaly was observed above the HF zone. Analysis of the simulation results at different HF stages showed that as new hydraulic fractures appeared and were filled with electrically conductive proppant, the total effect increased. The data on electric field anomaly demonstrated maximum deviation from the background level of more than 2 %. Provided that the studied formation is characterized by sufficient electrical conductivity, its magnetic field also becomes informative.
None
Introduction
Hydraulic fracturing (HF) applied at hard-to-recover oil fields is one of the most difficult types of work in the oil and gas industry. All over the world, HF technology is widely used for the development of low-permeability reservoirs [1, 8, 13]. The operating principle of HF is that at high pressure, caused by the injection of a liquid (proppant), the aperture of natural fractures or formation of artificial ones results in enhanced production of hard-to-recover oil [23, 28, 29]. The HF method has been known since 1950s, its effectiveness has been confirmed by test results [17, 24, 36], laboratory analysis of core sample characteristics from the HF zone [9, 32, 33] and geophysical studies of wells [30, 31, 35].
In the course of HF treatment, one of the key tasks is to determine the position and volume of proppant-supported fractures. The main tool of HF monitoring is microseismic monitoring [8, 34, 36], the point of which is to record seismic vibrations caused by the formation of hydraulic fractures. This method allows to estimate the strike, size and geometry of hydraulic fractures at sufficiently large distances from the observation site (in the wells or on the surface) [10, 25, 37].
Electromagnetic (EM) monitoring is another potentially promising option that allows to identify zones supported by the proppant [15, 18, 19]. Due to weak anomalies of the natural EM field of the HF zone and significant intensity of technogenic EM interference [6, 40], it is preferable to use EM field of the controlled source [16, 26, 38]. Therefore, the method of electric prospecting considered in this paper is close to frequency sounding or CSEM (controlled source electromagnetic method), which has shown high efficiency in deep exploration of wells, both onshore [4, 11, 14] and offshore [5, 12, 14].
The purpose of this study is to assess the effectiveness of using a certain method of conducting EM monitoring of hydraulic fracturing by solving the direct problem for the selected medium models.
Numerical modeling is a widely used approach to a priori estimation of HF parameters [27, 34]. Analysis of Russian and foreign publications [21, 23] demonstrates that the best result is obtained by low-frequency borehole-surface surveys. Based on the experience of studying sedimentary basins to the depth of first kilometers, the frequency of EM monitoring should be selected in the range of 0.05-10 Hz. The advantage of using lower-frequency waves is associated with greater exploration depth and low electrical resistivity of the studied medium. A signal of higher frequency may become undescriptive due to the skin effect [20, 22].
Hence, it was decided to consider EM monitoring based on repeated measurements of the low-frequency field of the source (a vertical electric dipole), located inside the well in the reservoir interval. The method is based on recording the amplitudes of EM field components that reflect different size and structure of electrically conductive volume, created by the proppant injected into the formation.
To achieve the set goal, mathematical modeling was performed, and its results indicated the applicability of this method for HF monitoring. We compared the results of solving the direct problem for two models – a model with homogeneous reservoir resistivity and a model with the presence of conductive proppant in the layer. These models correspond to the situations before and after HF treatment and make it possible to estimate the magnitude of changes caused by the HF procedure.
Analysis of results included identification of dependency between frequency and the amplitude of EM field signal, as well as assessment of changes in the behavior of EM field anomaly with the emergence of new HF stages.
Methodology
The functionality of MAXWELLF software [3, 4], used in mathematical modeling of EM field anomalies caused by hydraulic fractures, has been described in previous publications [2, 7]. This paper addresses specific geoelecric models with a particular system of observations.
In this study, the supply line (i.e. a controlled source of EM field) for geoelectric models was represented by a vertical electric dipole with a length of 100 m, located at a depth interval of 2.0-2.1 km. The current in the controlled source was 100 A. The observation system was represented by 9 surface profiles, located parallel to each other. The length of each profile was 3.2 km, the distance between them was 325 m, and the distance between observation points was 100 m. At each observation point, there were two receivers of electric field components (Ex, Ey – horizontal components of electric field intensity along the x and y axes, V/m) and three receivers of magnetic components (Hx, Hy – horizontal components of magnetic field intensity along the x and y axes, A/m; dBz/dt – time derivative of the magnetic induction, nT/m).
After solving the direct problem, the output provided real and imaginary values of two electric (Ex and Ey) and three magnetic components (Hx, Hy and dBz/dt) for each observation point. In subsequent calculations, we first considered two components of the electric field – Ex and Ey, which were converted into a single value of horizontal component of electric field intensity (Еhor – a complex value that incorporates Ex and Ey components). Еhor was calculated using the formula for a linearly polarized field:
The calculations were performed on the data in the frequency range of 0.06-3.93 Hz. A similar procedure was carried out for the horizontal component of magnetic field induction.
At the first stage of modeling, we obtained the characteristics of electric and magnetic fields before HF, which demonstrated the impact of surrounding medium on the measured EM field. At the second stage, after HF, electrically conductive proppant was introduced. A metal-coated propping agent with high electrical conductivity filled hydraulic fractures and created a sharp contrast in electrical conductivity against the background of the surrounding medium, exposing the system of hydraulic fractures as an object causing anomalies in electric and magnetic fields. The introduction of electrically conductive proppant was followed by the second round of data collection to obtain an anomalous response of EM field. The final visualization of results obtained after solving the direct problem was carried out in the form of electric and magnetic field anomalies, calculated by the following formulas:
where АE – electric field anomaly, %; EHF – electric field after HF, V/m; Ehom – electric field before HF, V/m; АM – magnetic field anomaly, nT; HHF – magnetic field after HF, nT; Hhom – magnetic field before HF, nT.
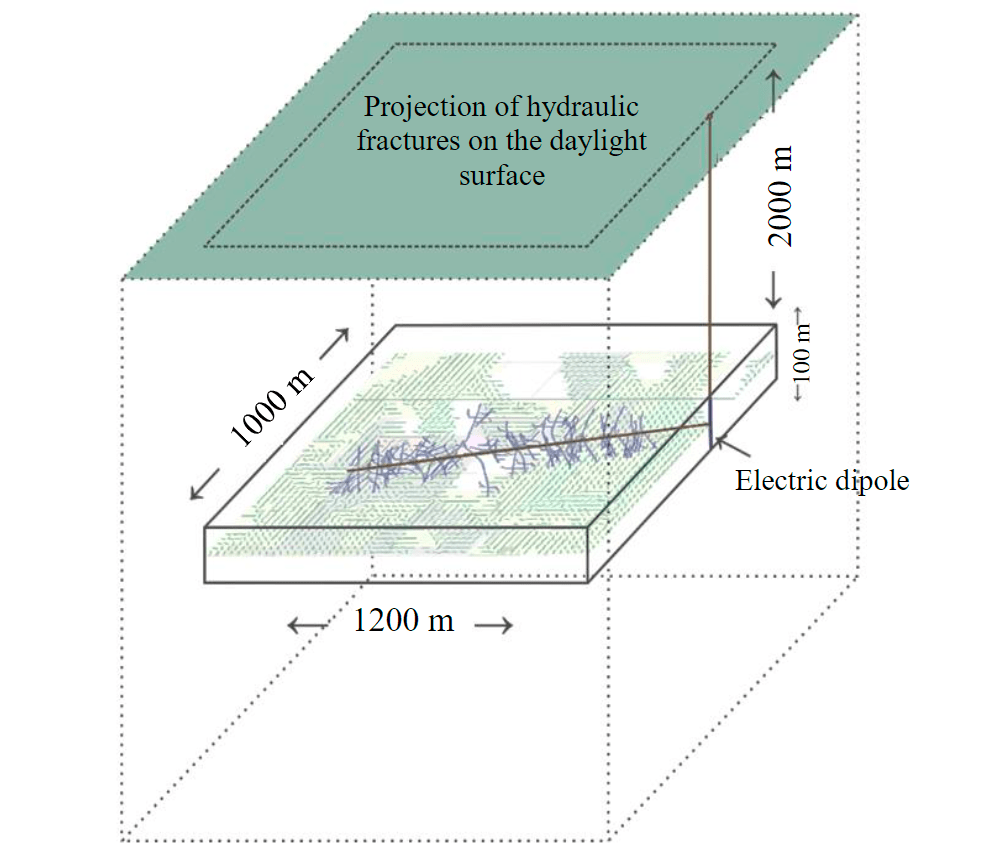
Fig.1. Medium model used in the simulation
Construction of geoelectric model
To assess the possibilities of EM monitoring, we built a 3D geoelectric model with a complex geometry, which consisted of a homogeneous half-space and an anomalous heterogeneous electrically conductive zone, corresponding to a system of fractures filled with proppant (Fig.1). In accordance with the functionality of the 3D modeling program, the geoelectric model was represented as a set of isotropic blocks with uniform electrical resistivity, each of them shaped as a prism with faces parallel to the coordinate planes xОy, xОz, yОz. The system of hydraulic fractures was represented by a block (1000 × 1200 × 100 m) placed in a homogeneous medium at a depth of 2000 m.
The simulation was carried out for a low-frequency EM field (quasi-stationary region), which allowed us to neglect the displacement currents. From the viewpoint of EM studies using quasi-stationary fields, it was important for the surrounding medium to have a low value of electrical resistivity, since conduction currents cannot pass through high-resistance objects. Therefore, the optimal value of electrical resistivity of the surrounding medium was 20 Ohm∙m.
An HF simulator was used to build an a priori model of artificial fracturing that occurred in the reservoir in the course of HF treatment.
The fractures were saturated with a proppant of high electrical conductivity – 1000 S/m. Since fracture aperture was 1 cm and lower, while horizontal dimension of the fractured zone exceeded 1 km at a depth of more than 2 km, for simulation purposes we had to transform this model into an equivalent one, comprised of relatively large blocks. To do this, blocks were added to the central part of the model in the depth range of 2.0-2.1 km; their electrical resistivity was selected in such a way as to obtain the average value in the corresponding volume of the model with fractures.
To estimate electrical resistivity of each block, we had to assess the share of the volume taken up by proppant-saturated fractures. By summing up the volumes of all fractures in a block, the share of the block volume saturated with proppant was obtained. Thus, the porosity coefficient was calculated through the ratio of total block volume taken up by the fractures and the volume of the block itself.
Electrical resistivity of the block was calculated using the simplified Archie-Dakhnov equation as a product of porosity parameter and electrical resistivity of the proppant. Using the approach described in the classical works by the pioneers of electromagnetic methods (Vanyan L.L., 1997), let us consider the model, where cubic grains are separated with continuous conducting films, and obtain the porosity parameter P = 1.5/Кp. Therefore, the required formula
where ρ – electrical resistivity of the block, Ohm∙m; ρp – electrical resistivity of the proppant (ρp = 0.001), Ohm∙m; Kp – porosity coefficient.
In the simulation, we considered the impact of a vertical casing, actual electrical resistivity of which reached 106 S/m with a diameter of approximately 150 mm. Such parameters could not be factored in by MAXWELLF software, so it was necessary to reduce electrical conductivity of the casing to the acceptable value, which would allow the program to calculate the behavior of EM filed. For this purpose, effective electrical conductivity was estimated:
where σef – effective electrical conductivity of the casing used in the simulation; σc – actual electrical conductivity of the casing, S/m; σsm – electrical conductivity of the surrounding medium, S/m; K – coefficient, determined as a ratio of casing volume to the volume of the entire block.
Using this formula to calculate effective electrical conductivity of the casing, we obtained a value of 997 S/m (in MAXWELLF software, maximum acceptable value of electrical conductivity for the block is 1000 S/m), its diameter equaled 3.2 m.
Discussion
The results of conducting EM monitoring of HF treatment are graphs and maps of the anomalous effect of electric and magnetic fields against the background level.
First, it was necessary to assess the dependency between frequency and the amplitudes of electric and magnetic field anomalies. Data obtained in the modeling process provides information about field amplitude at each frequency. So, a graph was plotted to distinguish the most beneficial and useful signal with an optimal frequency that allows to identify the positive effect exceeding the level of interference from electrically conductive fractured zone.
Analysis of the influence that signal frequency exerted on the amplitude of electric field anomaly demonstrated that the largest amplitude in a linearly polarized field originated from a signal with a frequency of 3.93 Hz (Fig.2, a). The reverse was true for the magnetic field: the signal with a minimum frequency of 0.06 Hz had the highest amplitude (Fig.2, b). Hence, the signals were used for subsequent mapping and plotting of these field anomalies. The final results of monitoring simulation were visualized as a gradual increase in the amplitude of EM field signal due to accumulation of its energy over time.
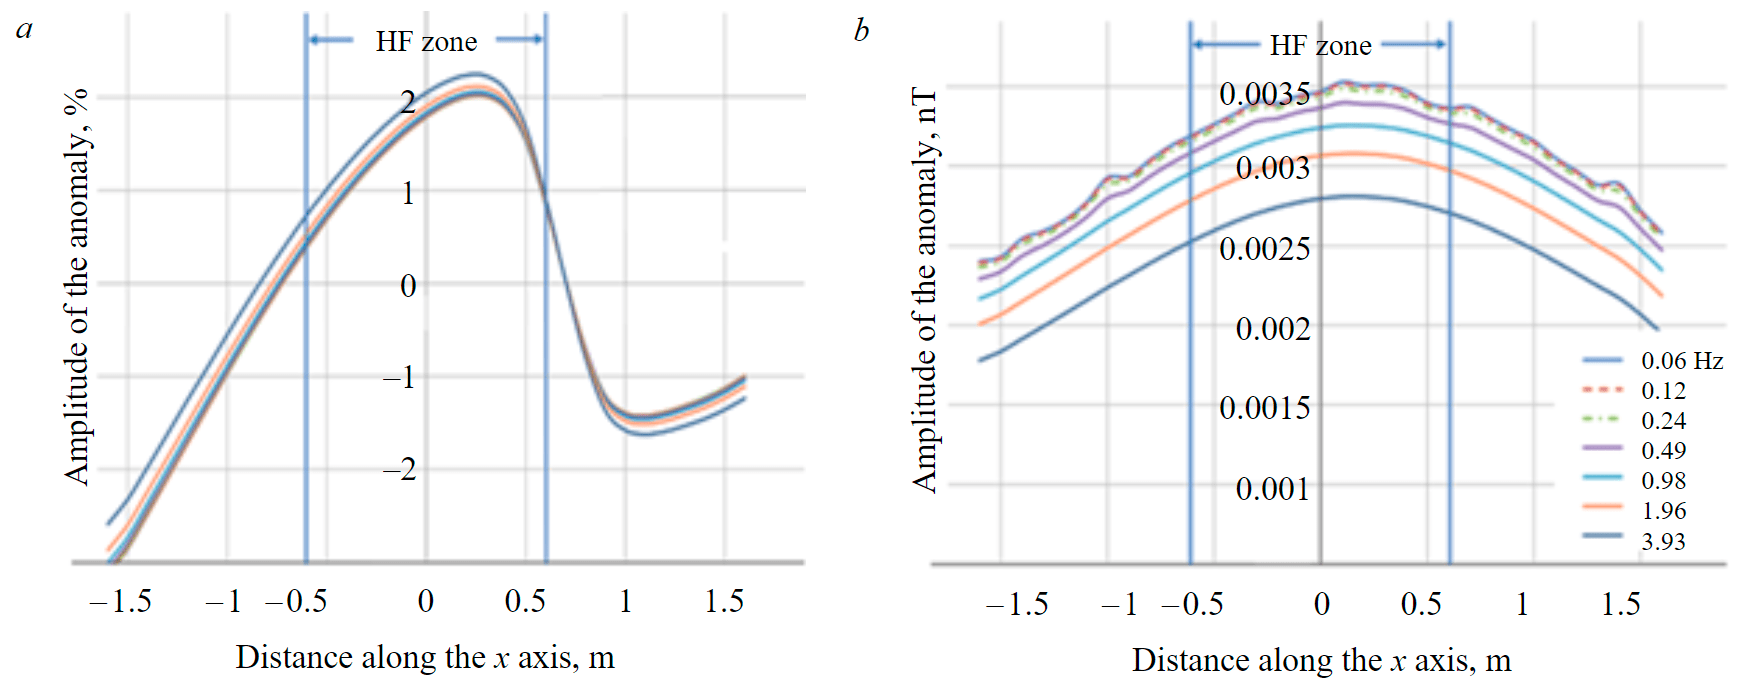
Fig.2. Graphs of dependency between frequency and the amplitudes of electric (a) and magnetic (b) field anomalies
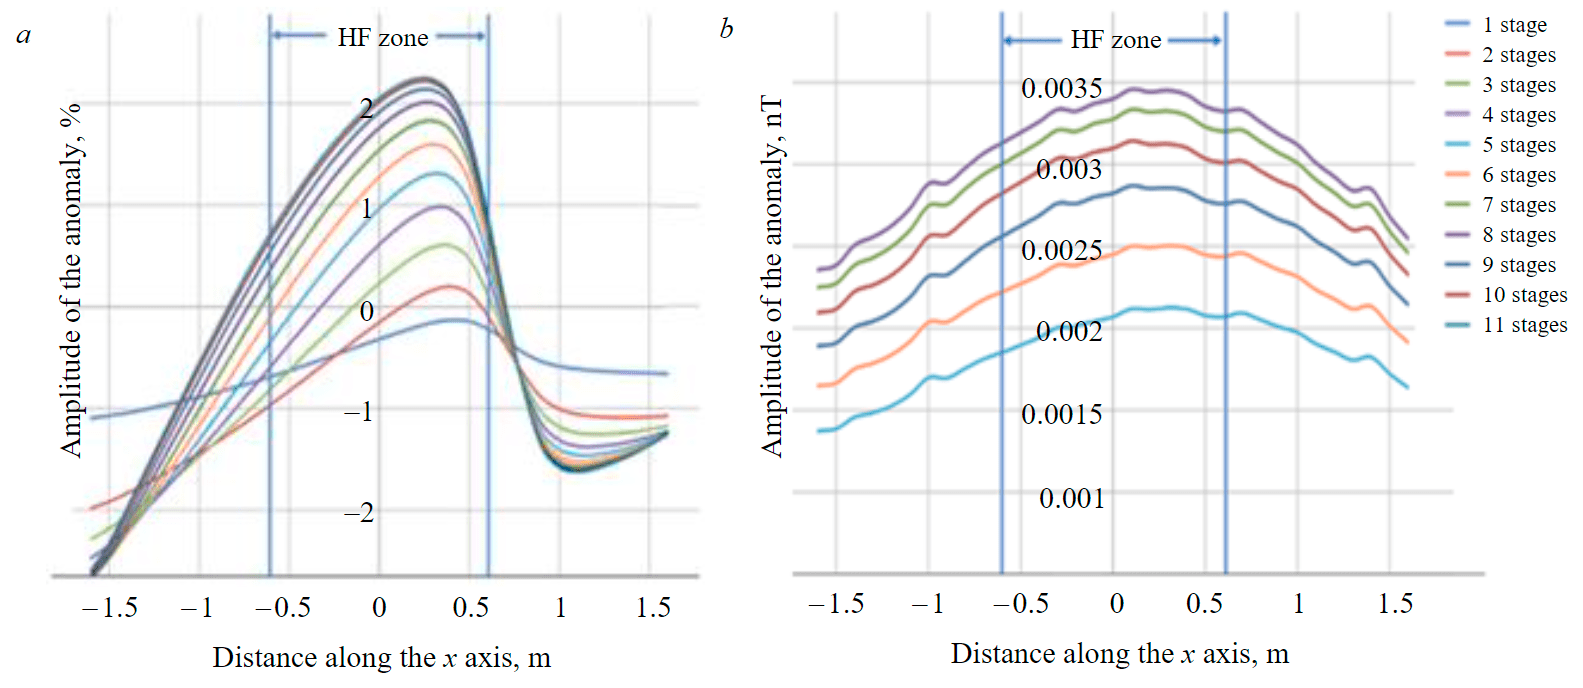
Fig.3. Dynamics of electric (a) and magnetic (b) field anomalies with the emergence of new HF stages (signal frequencies of 3.93 and 0.06 Hz, respectively)
Analysis of electric field anomaly at various HF stages (stages 1-11) (Fig.3, a) showed that as new hydraulic fractures emerged and were filled with electrically conductive proppant, the overall effect from the fractures increased. It should be noted that fractures formed at the first stage of HF did not provide a “positive effect”, as the anomaly did not reach a positive value. It can be assumed that the absence of a positive anomaly is caused by insufficient concentration of the conductive proppant in the fractures of the first stage. Starting from the second stage, the amplitude of the anomaly becomes positive. Since the graph (Fig.3, a) displays a cumulative effect of hydraulic fractures that increases with the formation of new fractures, the contribution of each stage can be assessed using the increment of anomaly amplitude after its completion. A conclusion can be drawn that stages 2-5 made the greatest contribution to the anomaly. This fact can be interpreted as the fractures having the largest concentration of proppant during these stages. After the fifth stage, each subsequent one had a smaller effect than the previous one. Stages 10 and 11 contributed to the anomaly least of all.
Data on the magnetic field partially correlate with electric field data. It should be noted that during the first four stages, magnetic field did not provide any meaningful information, and only starting from the fifth stage magnetic field data became interpretable. Based on Fig.3, b, a conclusion can be made that stages 5 and 6 made the greatest contribution to the increasing amplitude of magnetic anomaly, but with the emergence of new stages, their share in anomaly changes grew smaller. Same as with an electric field, the last HF stages had the smallest effect.
To demonstrate the dynamics of EM field anomaly depending on the geometry of the system of electrically conductive fractures, the maps were built (Fig.4 and 5).
Despite the fact that the presence of a steel casing can significantly distort the signal measured in the process of electric prospecting [39], the simulation results demonstrated a positive cumulative effect of electrically conductive hydraulic fractures – 2.23 % (Fig.3, a and 4). Analysis of the map revealed that with the emergence of new stages (formation of hydraulic fractures) the amplitude of the anomaly increased, and its peak was located above the zones with the highest electrical conductivity.
The same holds true for the anomaly of the magnetic field generated by a vertical source, which does not manifest itself on the surface in the absence of structures with elevated electrical conductivity. However, if a conductive heterogeneity emerges (hydraulic fractures filled with proppant), a magnetic field is bound to appear as well, and then it can be used to identify this heterogeneity and locate it on the surface. Starting from the fifth stage of HF treatment, the concentration of electrically conductive proppant in the fractures was sufficient for the magnetic field to become informative (Fig.3, b and 5).
The main problem of the recorded magnetic field consists in its weak intensity. The presence of high-amplitude interference sources near the field site will prevent extraction of a meaningful signal. This factor needs to be taken into account when measuring the magnetic field from hydraulic fractures, and no measurements should be taken in the immediate proximity to the sources of intense technogenic interference.
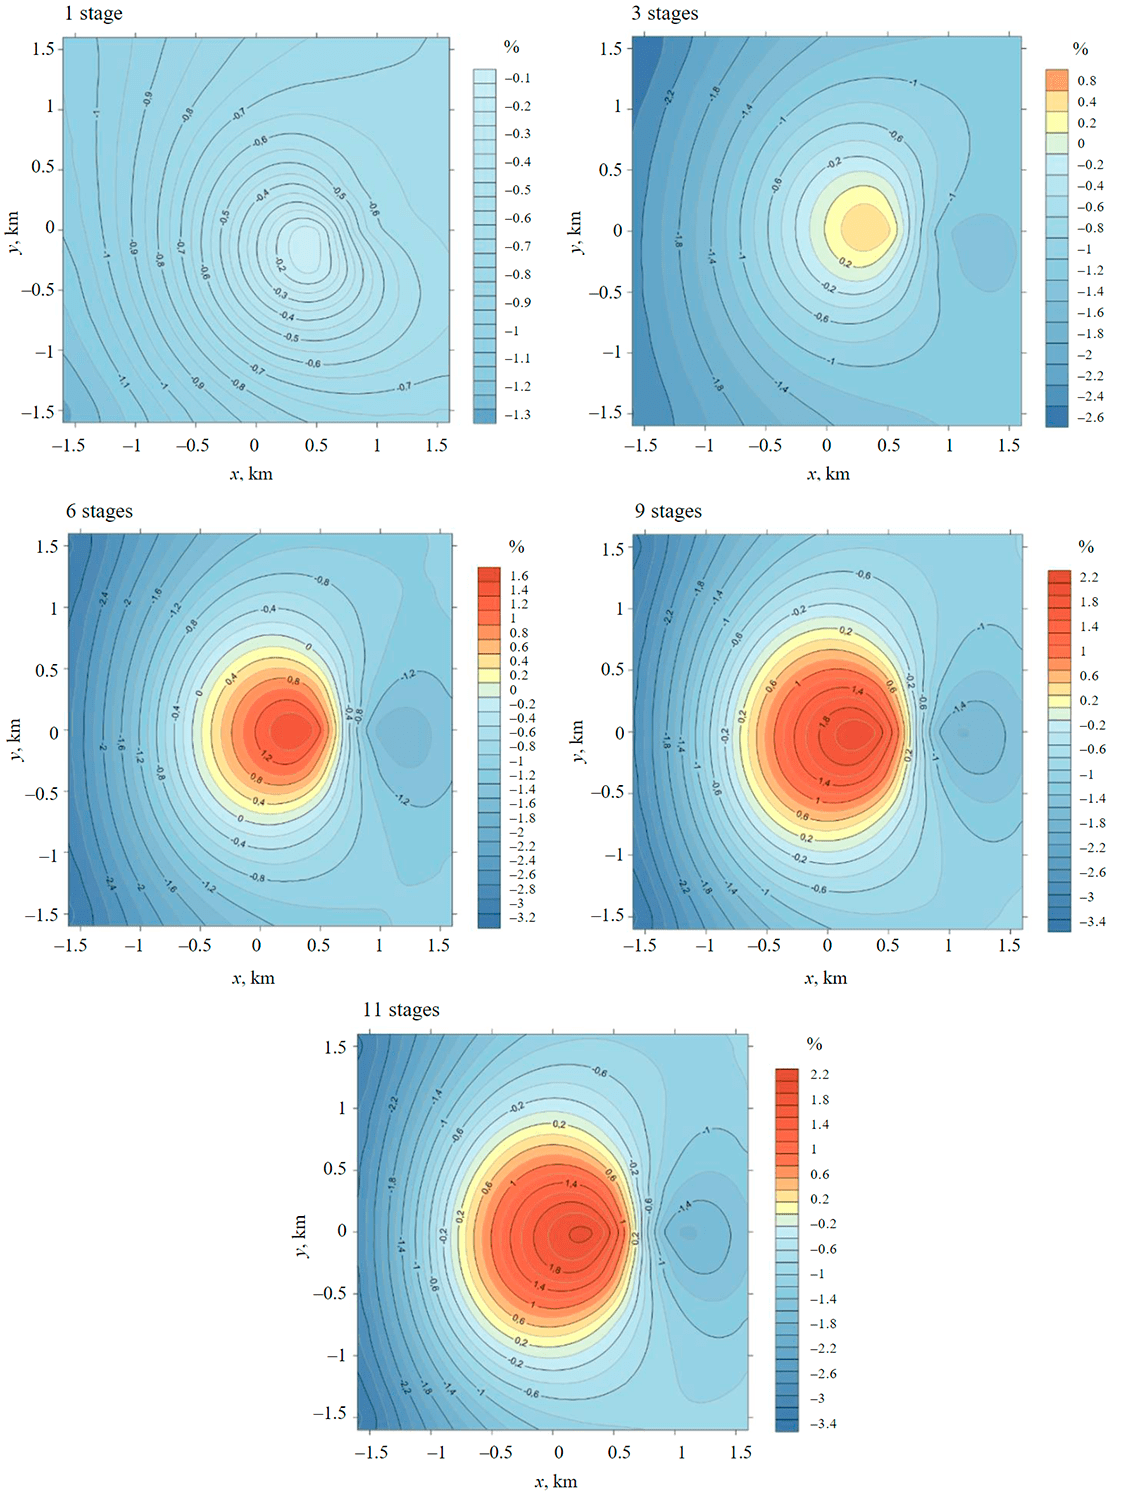
Fig.4. Maps of changes in electric field anomaly with the emergence of new HF stages (signal frequency of 3.9 Hz)
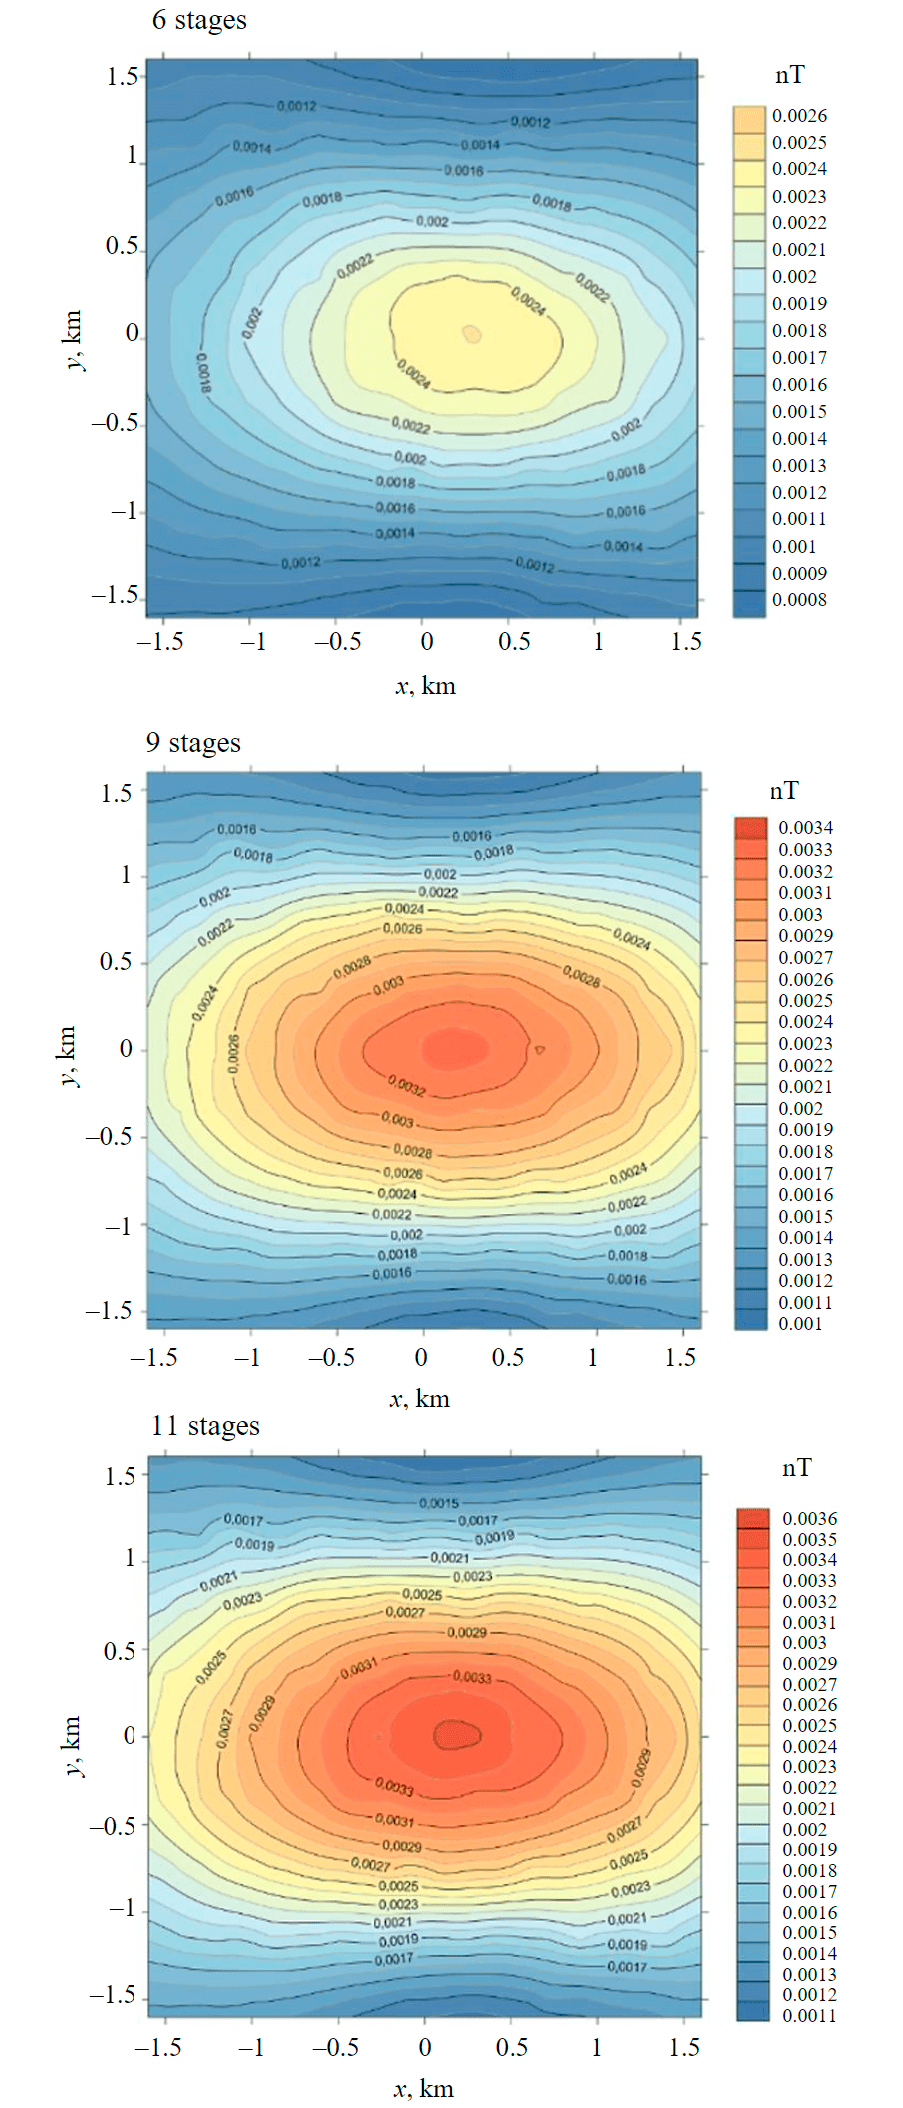
Fig.5. Map of changes in magnetic field anomaly with the emergence of new HF stages (signal frequency of 0.06 Hz)
Hence, the measurement procedure allowed to locate a high-amplitude anomaly of the electric field right above the HF zone. Given sufficient electrical conductivity of the studied object, magnetic field can be also considered informative. The presence of a steel casing reduced the effect, since a part of EMF energy was directed to the excitation of currents in the casing. Despite this fact, no strong distortion of EM field anomaly was observed above the HF zone.
Conclusions
The key distinction of this work from the previous studies, described in publications [2, 7], is in successive testing of HF stages, which demonstrated certain patterns in the behavior of electric and magnetic field anomalies. We identified the stages that exerted the greatest and the least influence on the cumulative effect of the conductive fractured zone. The simulations took into account the impact of a vertical casing, which did not have a negative effect on the obtained signal. Such results provide an opportunity to solve an inverse problem using real-world data obtained in the course of field tests.
To sum it up, the application of an electromagnetic sounding system with a controlled source, grounded in the reservoir interval, and areal surface measurements can provide positive results for HF monitoring (provided that a highly conductive proppant is used). The optimal range of frequencies in a linearly polarized field is from 0.1 to 10 Hz, since the signal of higher frequency may become undescriptive due to the skin effect. In this study, the signals with frequencies 3.93 and 0.06 Hz were used.
The main objective is to perform field tests of EM monitoring to obtain the real-world data and compare them to the results of mathematical modeling. In addition to that, it should be examined how the behavior of EM field anomaly is affected by a horizontal casing, located in the reservoir. Taking into account the impact of horizontal casing on the results of field tests will allow to identify the most optimal method for solving the inverse problem and to correctly interpret the data.
References
- Kudryashov S.I., Bachin S.I., Afanasev I.S. et al. Hydraulic Fracturing as a Way of Low-Permeable Reservoirs Development. Neftyanoe khozyaistvo. 2006. N 7, p. 80-83 (in Russian).
- Grigorev G.S., Salishchev M.V., Pushkarev P.Yu. Electromagnetic Fracturing Monitoring Application for Propped Reservoir Volume Determination. Geofizika. 2018. N 4, p. 90-93 (in Russian).
- Druskin V.L., Knizhnerman L.A. Review of the Main Studies at the Mathematical Modeling Department of Central Geophysical Expedition during the Period of 1981-2006. Geofizika. 2007. N 4, p. 61-65 (in Russian).
- Zhamaletdinov A.A. Theory and Method of Deep Electromagnetic Sounding with Powerful Controlled Sources (Attempt of Critical Analysis). St. Petersburg: SOLO, 2012, p. 163 (in Russian).
- Ingerov O.I. Modern Trends in the Development of Hardware System for Onshore and Offshore Electric Prospecting. Materialy pyatoi Vserossiiskoi shkoly-seminara imeni M.N.Berdichevskogo i L.L.Vanyana po elektromagnitnym zondirovaniyam Zemli – EMZ-2011, 16-21 maya, 2011, Sankt-Peterburg, Rossiya. St. Petersburg: SPbGU, 2011. Book 1, p. 86-103 (in Russian).
- Mogilatov V.S. Poorly studied phenomena in geoelectrics. Journal of Mining Institute. 2017. Vol. 222, p. 783-788. DOI: 10.18454/PMI.2016.6.783
- Grigorev G.S., Salishchev M.V., Popov D.D., Pushkarev P.Yu. Electromagnetic Fracturing Monitoring Application for Propped Reservoir Volume Determination. PROneft. Professionalno o nefti. 2018. N 4 (10), p. 39-43. DOI: 10.24887/2587-7399-2018-4-39-43 (in Russian).
- Burenina I.V., Avdeeva L.A., Soloveva I.A. et al. Improving Methodological Approach to Measures Planning for Hydraulic Fracturing in Oil Fields. Journal of Mining Institute. 2019. Vol. 237, p. 344-353. DOI: 10.31897/PMI.2019.3.344
- Shakurova Al.F., Shakurova Ai.F. Modeling of a Formation Hydraulic Fracture. Neftegazovoe delo: elektronnyi nauchnyi zhurnal. 2014. N 2, p. 33-47 (in Russian).
- Shmakov F.D. Surface Microseismic Monitoring of Hydraulic Fracture: Data Processing and Interpretation. Tekhnologii seismorazvedki. 2012. N 3, p. 65-72 (in Russian).
- Vilamajo E., Rondeleaux B., Queralt P. et al. A land controlled-source electromagnetic experiment using a deep vertical electric dipole: experimental settings, processing, and first data interpretation. Geophysical Prospecting. 2015. Vol. 63. Iss. 6, p. 1527-1540. DOI: 10.1111/1365-2478.12331
- Garina S.J., Ivanov S.A., Kudryavceva E.O. et al. Analysis of relationship of DNME polarization parameters with reservoir properties. 78th EAGE Conference and Exhibition 2016: Efficient use of Technology – Unlocking Potential, 30 May-2 June, 2016, Vienna, Austria. European Association of Geoscientists & Engineers, 2016. Vol. 2016, p. 1-5. DOI: 10.3997/2214-4609.201601088
- Benson Lamidi A-L. Semi-analytical assessment of condensate banking effects in fracture design and optimisation of gas-condensate reservoirs. Innovations in Geosciences – Time for Breakthrough, 9-12 April, 2018, St. Petersburg, Russian Federation. European Association of Geoscientists & Engineers, 2018. Vol. 2018, p. 1-5. DOI: 10.3997/2214-4609.201800142
- Tietze K., Ritter O., Patzer C.e t al. Borehole controlled-source electromagnetics for hydrocarbon-saturation monitoring in the bockstedt oil field, onshorenorthwest Germany. SPE Reservoir Evaluation and Engineering. 2018. Vol. 21. Iss. 2, p. 364-372. DOI: 10.2118/183165-PA
- Constable S. Ten years of marine CSEM for hydrocarbon exploration. Geophysics. 2010. Vol. 75. Iss. 5, p. 75A67-75A81. DOI: 10.1190/1.3483451
- Yan Liang-Jun, Chen Xiao-Xiong, Hao Tang et al. Continuous TDEM for monitoring shale hydraulic fracturing. Applied Geophysics. 2018. Vol. 15. Iss. 1, p. 26-34. DOI: 10.1007/s11770-018-0661-1
- Roy D.G., Singh T.N., Kodikara J., Talukdar M. Correlating the mechanical and physical properties with mode-I fracture toughness of rocks. Rock Mechanics and Rock Engineering. 2017. Vol. 50, p. 1941-1946. DOI: 10.1007/s00603-017-1196-0
- Bording T., Kühl A.K., Fiandaca G. et al. Cross-borehole geoelectrical time-lapse monitoring of in situ chemical oxidation and permeability estimation through induced polarization. Near Surface Geophysics. 2021. Vol. 19. Iss. 1, p. 43-58. DOI: 10.1002/nsg.12131
- Cuevas N. Surface-borehole electromagnetic method – a review on the technology development and potential for geothermal applications. EAGE/BVG/FKPE Joint Workshop on Borehole Geophysics and Geothermal Energy, 22 November, 2019, Munich, Germany. European Association of Geoscientists & Engineers, 2019. Vol. 2019, p. 1-2. DOI: 10.3997/2214-4609.201903164
- T.Palisch, W.Al-Tailji, L.Bartel et al. Far-field proppant detection using electromagnetic methods: Latest field results. SPE Production & Operations. 2018. Vol. 33. Iss. 3, p. 557-568. DOI: 10.2118/184880-MS
- Heagy L.J., Oldenburg D.W. Modeling electromagnetics on cylindrical meshes with applications to steel-cased wells. Computers and Geosciences. 2019. Vol. 125, p. 115-130. DOI: 10.1016/j.cageo.2018.11.010
- Hickey M.S., Treviño S., Everett M.E. Monitoring and imaging the dynamics and extent of hydraulic fracturing fluid movement using ground-based electromagnetics, with application to the eagle ford shale. SPE/AAPG/SEG Unconventional Resources Technology Conference, 20-22 July, 2015, San Antonio, Texas, USA. OnePetro, 2015. N URTEC-2172634-MS. DOI: 10.15530/URTEC-2015-2172634
- Lin Hun, Zhou Xiang, Chen Yulong et al.Investigation of the factors influencing the flowback ratio in shale gas reservoirs: A study based on experimental observations and numerical simulations. Journal of Energy Resources Technology, Transactions of the ASME. 2021. Vol. 143. Iss. 11. N 113201. DOI: 10.1115/1.4049605
- Kopeikin R.R., Shagiakhmetov A.M. The algorithm for calculating a multi-stage hydraulic fracturing for a horizontal well. Horizontal Wells 2019: Challenges and Opportunities, 27-31 May, 2019, Kaliningrad, Russian Federation. European Association of Geoscientists & Engineers, 2019. Vol. 2019, p. 1-6. DOI: 10.3997/2214-4609.201901878
- Hull R., Meek R., Bello H. et al. Monitoring horizontal well hydraulic stimulations and geomechanical deformation processes in the unconventional shales of the midland basin using fiber-based time-lapse VSPs, microseismic, and strain data. The Leading Edge. 2019. Vol. 38. Iss. 2, p. 130-137. DOI: 10.1190/tle38020130.1
- Qingyun Di, Guoqiang Xue, Changchun Yin, Xiu Li. New methods of controlled-source electromagnetic detection in China Science China Earth Sciences. 2020. Vol. 63, p. 1268-1277. DOI: 10.1007/s11430-019-9583-9
- Yang Jian Ping, Chen Wei Zhong, Yang Dian Sen, Yuan Jing Qiang. Numerical determination of strength and deformability of fractured rock mass by FEM modeling. Computers and Geotechnics. 2015. Vol. 64, p. 20-31. DOI: 10.1016/j.compgeo.2014.10.011
- Yongquan Hua, Qiang Wangab, Jinzhou Zhao et al. Numerical simulation of complex fracture geometry caused by hydrodynamics in shale with pre-existing weak planes. Journal of Petroleum Science and Engineering. 2021. Vol. 199. N 108306. DOI: 10.1016/j.petrol.2020.108306
- Zhaopeng Zhua, Xianzhi Songa, Gensheng Li. Prediction of the settling velocity of the rod-shaped proppant in vertical fracture using artificial neural network. Journal of Petroleum Science and Engineering. 2021. Vol. 200. N 108158. DOI: 10.1016/j.petrol.2020.108158
- Rovnik N.A., Lushpeev V.A., Tananykhin D.S., Shpurov I.V. Rational gas inflow restriction technologies during the development of oil rims. Topical Issues of Rational use of Natural Resources. 2019, p. 888-900. DOI: 10.1201/9781003014638-54
- Sabukevich V.S., Podoprigora D.G., Shagiakhmetov A.M. Rationale for selection of an oil field optimal development system in the eastern part of the Pechora sea and its calculation. Periodico Tche Quimica. 2020. Vol. 17. Iss. 34, p. 634-655.
- Raupov I., Podoprigora D. Laboratory researches of the polymeric composition in the pore space of bulk models. International Journal of Applied Engineering Research. 2017. Vol. 12. N 3, p. 365-371.
- Raupov I.R., Korobov G.Y. Research of polymer compositions rheological properties for oil production. Acta Technica. 2018. Vol. 63. N 3, p. 493-500.
- Rybin A., Bataleva E., Nepeina K. et al. Response of cracking processes in variations of geophysical fields. Journal of Applied Geophysics. 2020. Vol. 181. N 104144. DOI: 10.1016/j.jappgeo.2020.104144
- Shadrin A.V., Klishin V.I. The methodology for working out the techniques for geophysical monitoring of the process of directional hydraulic fracturing of a hard roof and the process of local hydrotreating of a coal seam face working space, its implementation within the framework of RSF project. International Scientific Conference “Knowledge-based technologies in development and utilization of mineral resources” 5-8 June, 2018, Novokuznetsk, Russian Federation. IOP Conference Series: Earth and Environmental Science, 2018. Vol. 206. DOI: 10.1088/1755-1315/206/1/012022
- Shagiakhmetov A., Tananykhin D. The development of a water proofing polymeric composition based on carboxymethylcellulose for carbonate reservoirs. International Journal of Applied Engineering Research. 2017. Vol. 12. N 2, p. 273-276.
- Thiel S. Electromagnetic monitoring of hydraulic fracturing: Relationship to permeability, seismicity, and stress. Surveys in Geophysics. 2017. Vol. 38, p. 1133-1169. DOI: 10.1007/s10712-017-9426-2
- Treviño-Reséndez J.D.J., Medel A., Meas Y. Electrochemical technologies for treating petroleum industry wastewater. Current Opinion in Electrochemistry. 2021. Vol. 27. N 100690. DOI: 10.1016/j.coelec.2021.100690
- Um E.S., Kim Jihoon, Wilt M. 3D borehole-to-surface and surface electromagnetic modeling and inversion in the presence of steel infrastructure. Geophysics. 2020. Vol. 85. Iss. 5, p. E139-E152. DOI: 10.1190/geo2019-0034.1
- De Almeida A., Maciel D.F., Sousa K.F. et al. Vertical electrical sounding (VES) for estimation of hydraulic parameters in the porous aquifer. Water. 2021. Vol. 13. Iss. 2. N 170. DOI: 10.3390/w13020170