
Experience in conducting magnetotelluric surveys using active electrodes with preamplifiers in the Prydz Bay area, East Antarctica
- 1 — Engineer of the 2nd Category Empress Catherine II Saint Petersburg Mining University ▪ Orcid
- 2 — Postgraduate Student Empress Catherine II Saint Petersburg Mining University ▪ Orcid
- 3 — Ph.D., Dr.Sci. Head of Department Empress Catherine II Saint Petersburg Mining University ▪ Orcid
- 4 — Engineerof the 1st Category Empress Catherine II Saint Petersburg Mining University ▪ Orcid
- 5 — Ph.D. Leading Engineer Empress Catherine II Saint Petersburg Mining University ▪ Orcid
- 6 — Engineer of the 2nd Category Empress Catherine II Saint Petersburg Mining University ▪ Orcid
- 7 — Ph.D. Associate Professor Empress Catherine II Saint Petersburg Mining University ▪ Orcid
Abstract
The article presents the results of experimental and methodological work on the use of magnetotelluric sounding in the area of the Russian Progress Station (Princess Elizabeth Land, East Antarctica). The research was accomplished by a field team from the Saint Petersburg Mining University in the course of the 71st Russian Antarctic Expedition (2025-2026) and is a continuation of the comprehensive geological and geophysical studies of East Antarctica. The main focus is on the practical application of the method in high polar latitudes. Issues related to ensuring the operability of the equipment, fieldwork logistics, and the influence of physiographic conditions on measurements are considered. The study of the geological structure of the Antarctic continent is complicated by the occurrence of a thick ice sheet which ensures the leading role of geophysical methods in solving this problem. The article presents the results of practical application of the Russian Nord electrical prospecting hardware-software measurement system and the Canadian MTU-5A together with preamplifiers designed to compensate for a high grounding contact resistance. The experimental and methodological survey line is laid across the Amery lineament, a large linear magnetic anomaly extending sublatitudinally for over 500 km. A comprehensive interpretation of magnetotelluric data and the anomalous magnetic field was accomplished. A resistivity section was constructed using a two-dimensional inversion, and a direct problem for the magnetic field was solved. As a result, a model is proposed for the structure of the Proterozoic suture zone, the rocks of which create a positive anomaly in the magnetic field. In the resistivity section, the anomalies with increased conductivity at depths below 10 km correspond to this structure. The obtained data create new opportunities for studying the deep structure and geodynamics of the East Antarctica.
The research was conducted with a subsidy for the implementation of the State assignment in the sphere of scientific activity for 2024 (N FSRW-2024-0003).
Introduction
The Prydz Bay fold belt has traces of the Grenvillian and Neoproterozoic-Cambrian orogeny making its study the key to understanding the evolution of the Rodinia and Gondwana supercontinents [1-3]. In the area of the Progress Station, in the sublatitudinal direction, a large linear magnetic anomaly occurs called the Amery lineament [4]. The closest bedrock exposures are in the Larsemann Hills oasis within which ortho- and paragneisses of the amphibolite and granulite facies crop out [5-7]. The results of subglacial drilling showed that the magnetic anomaly was mainly caused by mafic granulites, the protoliths of which formed in an island arc environment approximately 970 Ma ago during collision of the Rayner Province with the Indian Craton. These rocks subsequently underwent granulite and amphibolite facies metamorphism. Pyrrhotite, pyrite, chalcopyrite, magnetite, and ilmenite were found in the rock samples [8].
Magnetotelluric sounding (MTS) was successfully applied in Antarctica for refining the deep structure of the Earth’s crust and the upper mantle since 1964 [9, 10]. The analysis of the distribution of electrical conductivity anomalies in crustal rocks allows to identify deep faults, delineate large geological structures, and helps in the study of tectonic evolution of the study area. Conducting MTS in this area is complicated by extremely low temperatures, cracks in coastal parts of the glacier, violations of the plane-wave principle, the “coastal effect”, a thick ice sheet to 4 km (in the study area, the glacier thickness is to 800 m [11]) with high contact resistance as well as wind interference and the associated drifting snow – the movement of charged particles when snow is transported by the wind [10, 12]. To minimize the distorting effects, the graph for processing the recorded data was adapted, and the equipment was specially prepared; for example, the use of active electrodes with preamplifiers enables to minimize the influence of the high contact resistance of the glacier [13, 14], and extended receiving electrical lines reduce the influence of wind interference [15]. Increasing the duration of data recording to 5-7 days eliminates the problem associated with wind interference [16-18].
Previous magnetotelluric surveys of the Prydz Bay fold belt conducted in the course of the 36th China National Research Expedition (2019-2020) with the use of non-polarizing electrodes, provided insight into the nature of the geoelectric section from the coast to the central part of the Amery lineament to a depth of 60 km [19-21]. According to Chinese scientists, bodies of high electrical conductivity corresponding to the position of positive magnetic anomalies are associated with the anomalous effect of the Neoproterozoic suture zone between the Indo-Antarctica and the East Antarctica. Increased conductivity of the bodies was accounted for by a possible occurrence of graphite and sulfides associated with metamorphism during formation of suture zones.
The most important research objective of the field team from the Saint Petersburg Mining University in the course of the 71st Russian Antarctic Expedition (RAE) was the development of magnetotelluric sounding methodology in high polar latitude conditions in the area of the Progress Station (Princess Elizabeth Land, East Antarctica) on the glacier surface using active electrodes with preamplifiers. These studies are aimed at investigating the deep structure in the area of the presumed Proterozoic suture zone between the East Antarctica and the Indo-Antarctica and are a continuation of the comprehensive work program of the Saint Petersburg Mining University for the study of the East Antarctica [22-24]. The experimental survey line was laid across the strike of a linear positive magnetic anomaly.
Methods
During the 71st RAE season, magnetotelluric data were obtained at 13 sounding points, 11 of which were along the line running across the Amery lineament intersecting it completely. The investigated survey line has a total extent of 25 km running along the Progress – Vostok snow route, with 2.5 km spacing between the sounding points (Fig.1).
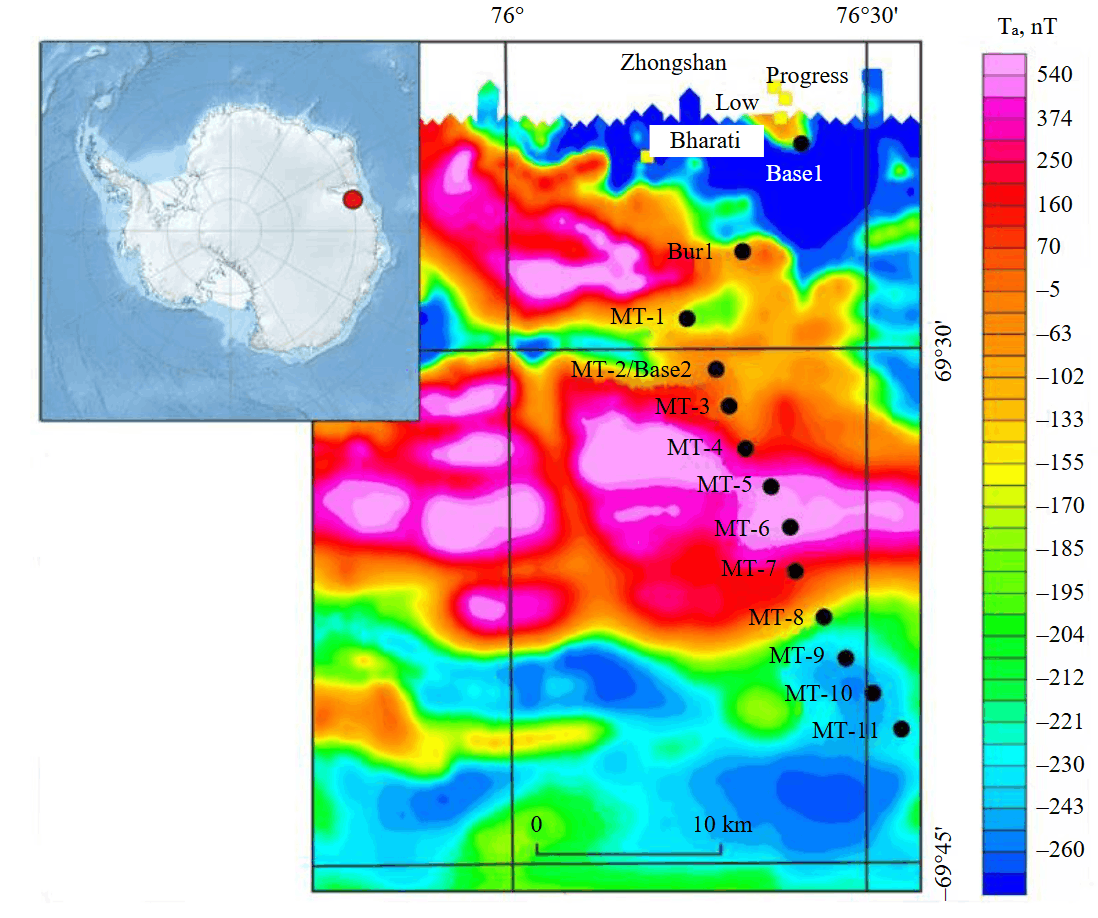
Fig.1. Anomalous magnetic field of western Princess Elizabeth Land [4]
MT – MTS points; Bur – drilling point; Base – base station
The experimental and methodological work (EMW) was performed using two types of hardware-software systems: the MTU-5A manufactured by Phoenix Geophysics Ltd and the Nord Plus manufactured by the Nord-West Ltd. A five-channel cross-shaped unit was used for measurements at the sounding point; azimuths of electric lines and the induction magnetic field sensors Hx and Hy were 0° and 90°, respectively. Five components of electromagnetic field were measured at each point: electric (Ex, Ey) and magnetic (Hx, Hy, Hz) (Fig.2). To reduce the influence of wind interference, 300 m long receiving electric lines were applied. Electric field variations in conditions of a thick ice sheet were recorded using active electrodes with preamplifiers (North-West Ltd.). The main characteristics of the preamplifiers are: frequency range 0.0001-1000 Hz, input impedance 1 MOhm, external bipolar power supply 12 V. The electrodes are made of stainless steel with overall dimensions 350×450×1.2 mm. At the initial stage of the EMW, grounding of metal plate electrodes was accomplished by burying them in the snow both horizontally to a depth of about 30 cm, and vertically. No differences were found in the contact resistance parameters, the value of the constant component of voltage between electrodes (DC), or the quality of resistance curves at different setup options. Further, to measure the electric field variations at sounding points, the plate of active electrodes was buried vertically, as this reduced the time required to set up and dismantle the equipment after completing the surveys. Contact resistances of the snow-firn layer in the study area ranged from 0.4 to 2 MOhm, with average values 0.6-0.8 MOhm. Magnetic field was recorded using low-frequency induction MTS-50 sensors (Phoenix Geophysics Ltd) and IMS-015 broadband induction sensors (OOO Vega).
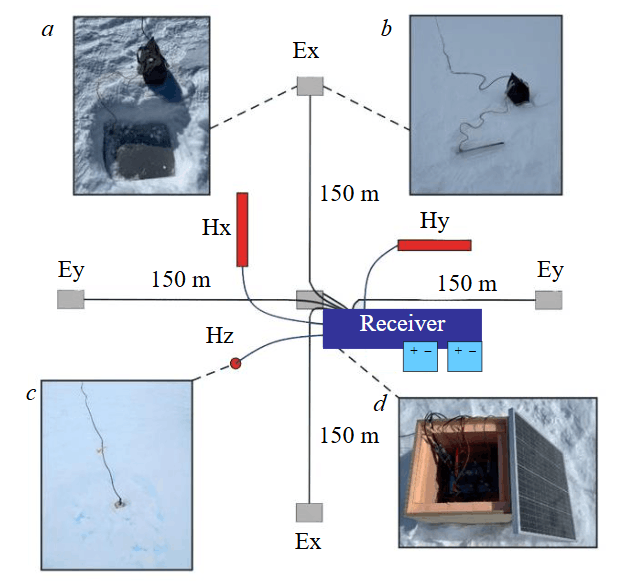
Fig.2. Scheme of MTS measurement unit.
Insets show electrode installation options: horizontal (a), vertical (b); operating position of vertical magnetic field sensor (c); use of a thermal box with a solar power supply system (d)
To reduce the effects of wind interference and temperature fluctuations, the Hx and Hy induction sensors were set up in the snow-firn layer to a depth of 30-40 cm and covered with snow. The Hz vertical magnetic field sensor was also completely buried in the snow, and the surface above it was levelled. Solar radiation during polar summers can significantly heat the surface of the plate electrodes, induction sensors and cables causing the snow around them to melt actively. This can have a negative effect on the quality of the recorded data due to a major change in the position of the induction sensor as well as a decrease of the contact area between the electrode plate and the snow.
Average equipment setup time at an MTS sounding point with extended 300-metre lines by two persons was 1.5-2 h. The time required to dismantle the MTS station from the recording point was 1 h. In case of a multi-day recording combined with prolonged snowstorms, thawing to a depth below 20 cm, and subsequent sweeping of magnetic and electric lines, the time required to remove the equipment from the sounding point increased to two hours.
Travel along the MTS line was accomplished using the Burlak snow and swamp vehicle. Travel time between points on the line (2.5 km) was approximately 10 min. In good weather and visibility, travel speed on the glacier roads can reach 40 km/h. In case of snowstorms, low clouds, and damp snow, travelling on the glacier can be difficult.
Before the pilot work began, the MTS measuring systems were calibrated, and the recording identity test was performed. Routine maintenance was accomplished directly on the glacier in the area of the MTS line. Six MTS instrument sets were used in the work, with three sets applied for routine measurements along the line.
Using a remote base point
To suppress the uncorrelated noise and improve the quality of the recorded data, measurements were taken synchronously with two remote base stations (one was selected for subsequent processing). The first base station (Base1) was set up in a partially glacier-free zone on the rock exposure 9 km from the MTS line; measurements were taken using the MTU-5A hardware-software system. The length of electric dipoles was 90 m, and grounding connections were made to the soil using NW-4 non-polarizing graphite electrodes (North-West Ltd). Grounding resistances ranged from 3.2 to 5.5 kOhm. The Hx and Hy induction magnetic field sensors were buried in the ground, and the Hz vertical induction sensor was mounted on an Agcos tripod.
The second base station (Base2) was set up on the survey line on the glacier, and measurements were taken using the Nord Plus hardware-software system. Base2 setup parameters are identical to those of the standard sounding points on the line.
Wind interference
Due to strong, prolonged winds on the glacier, the recording time for the MTS data had to be extended. Wind interference and the associated drifting snow have a major effect on the field data quality. Interference caused by drifting snow on the resistance curve is recorded in the frequency range 0.5-100 Hz. In time series for electrical channels, it manifests itself as values outside the dynamic range of the analogue-to-digital converter, or “off-scale” values. The number of “off-scale” values for electrical channels during recordings on the line varied from 17.1 to 33.4 % on different days; drifting snow has a lesser effect on magnetic channels. Wind interference associated with mechanical vibrations of wires does not significantly affect the recording quality, as the electric and magnetic wires are thawn in the snow and remain stationary.
Fieldwork was conducted from December 29, 2025, to February 4, 2026. From late December to mid-January, daytime temperatures in the area of the EMW testing site – drilling point – ranged from +5 to +10 °C in sunny weather, while nighttime temperatures varied between 0 and –5 °C. Snow was soft and damp. No drifting snow was recorded during this period. On the MTS line, which starts 5 km to the south, the temperatures were 3-5 °C lower than at the testing site. In good weather, drifting snow could be observed in the evening hours until the following morning. At the EMW testing site, there could be no drifting snow during this time. At cold spells (from mid-January), when daytime temperatures began to drop to –5 °С, at night the temperature decreased to –10 to –15 °С, wind speed increased, snowstorms began, and drifting snow started to appear at daytime on the line, and less frequently at the drilling point.
To minimise the impact of wind interference and obtain high‑quality MTS data, the recording time at the point was extended to 3-7 days. As a result of the work, the recommended recording time was determined which allows obtaining the values of electrical resistivity down to a depth of 50-100 km. Under favourable meteorological conditions, 36-48 h of continuous synchronous recording are required to obtain high-quality data. In adverse weather conditions, drifting snow, it is recommended to carry out measurements for more than 72 h in order to catch a weather window.
Thermal boxes
For long-term recordings at the MTS point at negative temperatures, the measuring stations together with a battery were set up in special thermal boxes with additionally heat insulated walls. Two 90 A∙h gel batteries were used for long-term recordings. The use of a thermal box demonstrated the need for it to be as airtight as possible to prevent snow from entering during strong winds and snowstorms. To ensure the box warms up better in the sun and is more visible against the snow, it is advisable to paint it a dark colour. Burying the box in snow to conserve heat is not necessary, including when working in Central Antarctica and at the Vostok Station, where snow temperature at a depth of about one meter does not rise above –40 °C [25]. A solar power system can be used to extend the recording time without replacing the battery. Eliminating the need for frequent battery replacement optimizes the fieldwork by reducing the overall weight of the equipment during transportation and minimizing battery charging costs.
Rapid assessment of field data quality
Rapid assessment of the quality of the MTS data was made every few days to determine whether the equipment could be moved to the next survey point. Data from Base2 point were checked – data from the Nord recorder were downloaded to a smartphone via Wi-Fi without interrupting the recording. Preliminary data processing and quality assessment of apparent resistivity curves were performed on the smartphone via a Web browser. If high levels of noise were detected on the calculated base point curve, further checks of regular points were discontinued; all the stations remained in place to continue recording.
The quality of the recorded data from the MTU-5A recorder was assessed using the EPI-KIT and MT-Corrector software (North-West Ltd) which are part of the Nord Plus hardware-software electrical exploration measuring system.
Field data from the Nord Plus and MTU-5A recorderswas processedusing the EPI-KIT software. For each sounding point, resistivity curves were calculated sequentially using two different base stations. The results were then compared, and one optimal solution was adopted for further work.
When calculating the MTS curves, sections of the time series with strong wind interference were cut out. Resistance curves with wind interference calculated together with the base point set up in a partially glacier-free area (Base1) have better quality as compared to the curves calculated with the base point set up on the line (Base2). For resistance curves without obvious wind interference, no difference in quality was recorded when calculating with different base points. For obtaining a high-quality telluric tensor, using a base point on the ground is advantageous.
To account for and evaluate the source effect (non-plane wave), the curve calculations were performed using the Jackknife robust processing version [26], and the time series analysis of the calculated transfer functions for the recording sections.
As a result, the impedance and phase curves were obtained in the range 0.0015-286 Hz using the MTU-5A system and 0.0015-1065 Hz using the Nord Plus system (Fig.3). Further, noisy sections of the recording were manually rejected for each frequency, and a spline was manually fitted to the averaged data using second-order dispersion relations, an algorithm for which is implemented in the MT-Corrector software [27-29].
In the MT-2-MT-8 curves, the impedance phase Zxy goes out of its quadrant in the mid- and low-frequency range (below 0.035 Hz), which can be due to the existence of a deep anisotropic conductor.
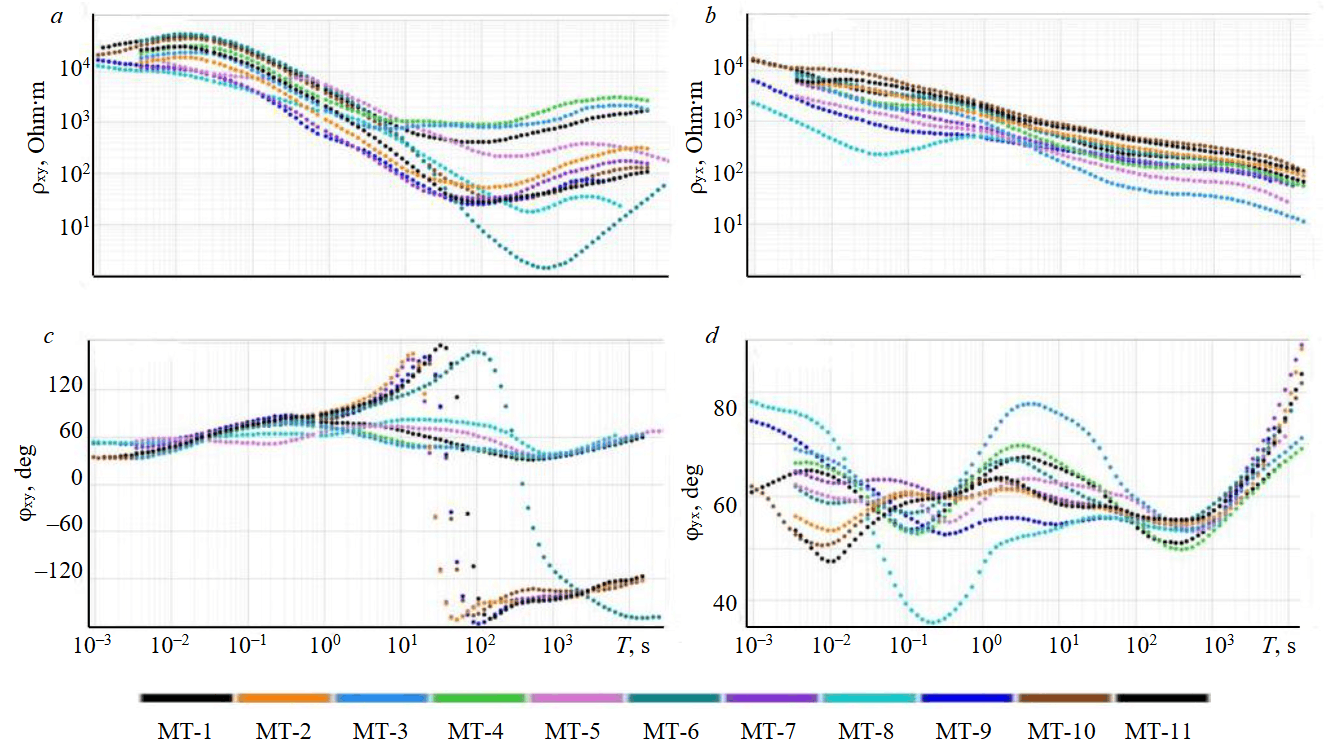
Fig.3. Curves of electrical resistivity xy (a) and yx (b) and impedance phase xy (c) and yx (d) at MT-1-MT-11 points
Discussion of results
The dimensionality of geoelectric medium was estimated from the magnetotelluric test [30] by means of the invariant parameters N, SkewB and β. Threshold values for the dimensionless quantities N and SkewB were set equal to 0.2, and for β – 3°. N parameter delineates one-dimensional regions; SkewB, two-dimensional or axisymmetric regions; and β, three-dimensional geoelectric structures.
Pseudo-sections of heterogeneity parameters indicate a deviation of the geoelectric medium from the one-dimensional one, as N parameter exceeds the threshold value across the entire frequency range. In the central part of the line, the SkewB parameter takes high values at frequencies below 10 Hz, indicating the presence of a three-dimensional object in the deep part of the section. β parameter which characterizes the asymmetry degree of the medium, also exhibits high values at frequencies below 10 Hz, but these values are localized within two distinct intervals – to 0.01 Hz and below 10–3 Hz (Fig.4), which can indicate a depth-limited three-dimensional object.
The azimuth of strike of geoelectric structures with an ambiguity of 90° was determined by analysis of the diagrams of principal directions and the phase tensor ellipses (Fig.4, d, e) constructed in the Inversio software (STC Nord-West). The final choice of the angle was made taking into account a priori information. The geoelectric section is characterized by two different strikes. For the upper part of the section (frequency range to 100 Hz), one of the principal directions is defined as 10°. Given the sublatitudinal strike of the magnetic anomaly, this azimuth is taken as a transverse direction. For the full frequency range and for the deep part, the angle varies, which can point to a regional structure or the influence of the ocean on the MTS data. In this case, the angle of 45° – parallel to the coastline – was taken as the longitudinal direction.
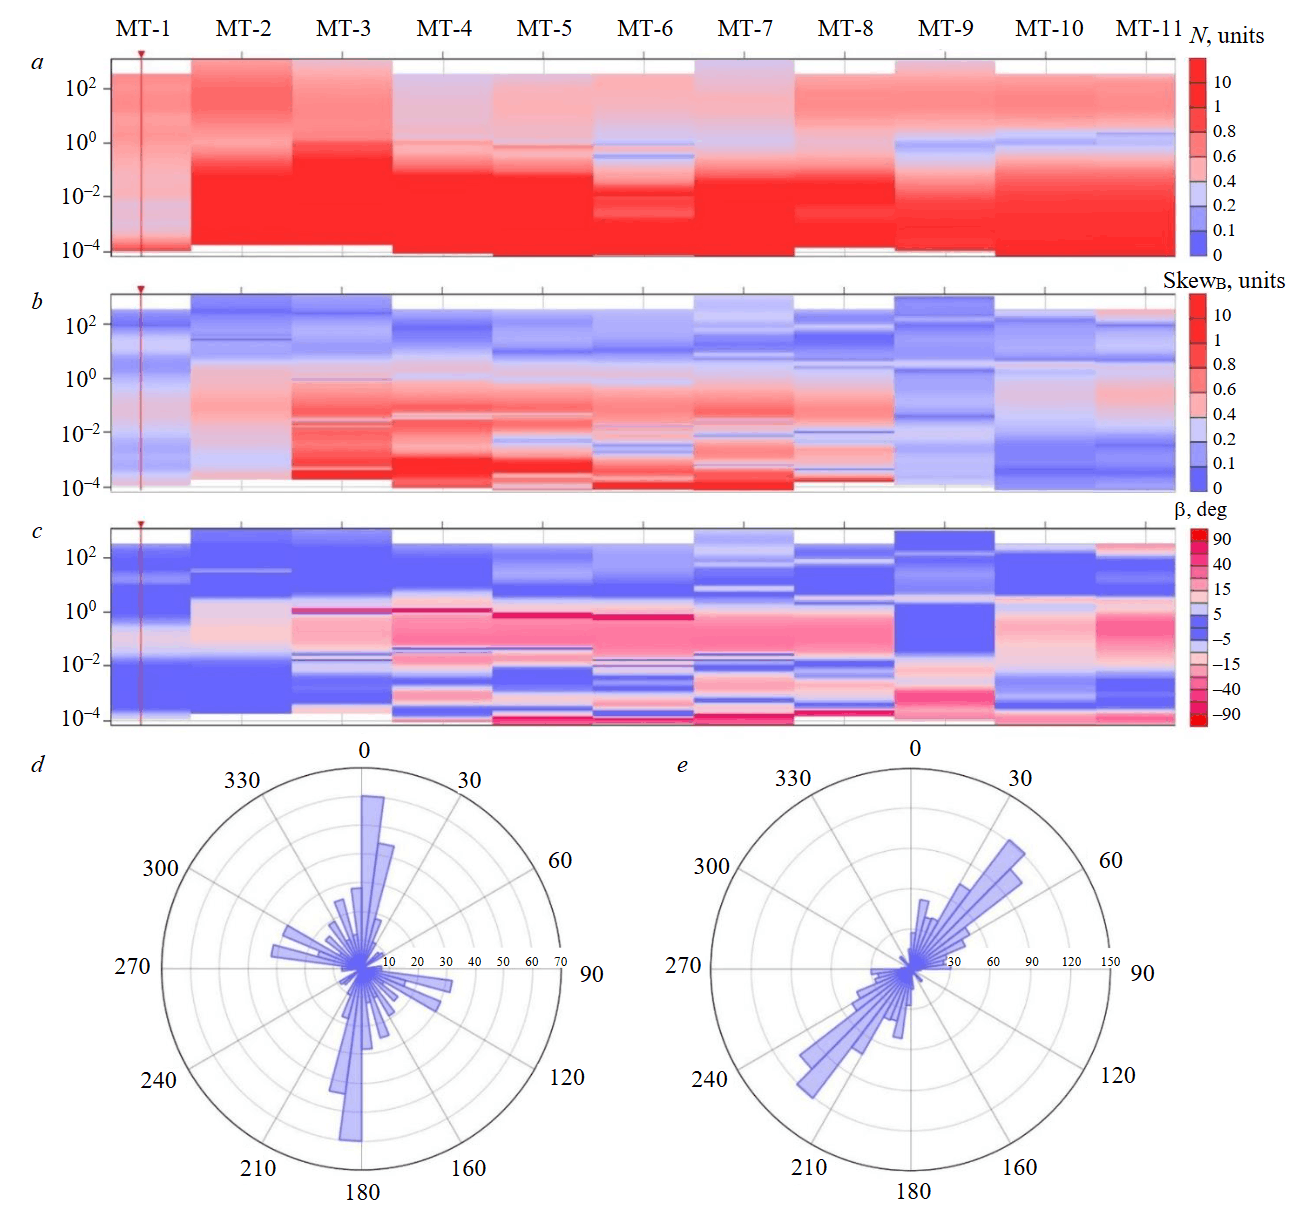
Fig.4. Heterogeneity parameters of the medium: N (a), SkewB (b), β (c), and diagrams of principal directions of phase tensor for 1-100 Hz range (d) and full frequency range (e)
For a comprehensive interpretation of geophysical data [31, 32], the results of aeromagnetic surveys carried out in the course of the 68th Russian Antarctic Expedition (2022-2023) are used in the article [4]. Data on the anomalous magnetic field are traditionally used to study the deep structure of different tectonic structures [33-35]. The Earth's crust section was simulated using an algorithm for solving the direct problem of magnetic surveying in the Oasis montaj software (Geosoft Inc.). The simulated section is laid along the magnetotelluric line. In their constructions, the authors proceeded from the assumption that a large linear magnetic anomaly is confined to the Proterozoic suture zone [8]. The magnetic field structure can be accounted for by induced magnetization of a deep-seated wedge-shaped suture with magnetic susceptibility χ = 70∙10–3 and two bodies in the upper crust with magnetic susceptibility χ = 35·10–3 interpreted as manifestation of a tectonic cover against the background of host rocks of the consolidated crystalline basement with magnetic susceptibility χ = 6.3·10–3 (Fig.5) using the normal field value T = 54,130 nT, inclination I = –71.64°, and declination D = –81.75°. Simulation provided a convergence between the observed and calculated magnetic field data with an error less than 15 nT.
Due to a small number of observation points and their linear arrangement, it was decided to perform a two-dimensional inversion, despite possible distortions from three-dimensional objects. Two-dimensional inversion of magnetotelluric data was carried out in specialized software WinGLink (Geosystem Srl). The result of one-dimensional inversion was used as the starting model. The grid for magnetotelluric inversion was created taking into account the topography, since there is a major difference in heights in the work area (about 470 m). Grid size is 77 rows and 37 columns, and the cells are rectangular in shape. Vertical division was partially set manually – first, the automatic division with a gradual increase of the cell size with depth, then additional division for a greater detail. Horizontal grid spacing is chosen, so that the minimum cell size is at least half the distance between the adjacent measurement points.
When constructing the deep geoelectric section, the x-axis was rotated by 45°. For inversion, the longitudinal and transverse components of magnetotelluric sounding and the tipper were used sequentially, since they have different sensitivities to geoelectric heterogeneities [30]. The regularization parameter τ varied from 30 to 3. At the first stage, the inversion was accomplished only for the longitudinal component, since it is more sensitive to deep structures. The inversion result served as a starting model for the second stage – inversion for the transverse component which better restores the upper part of the section, and the tipper, sensitive to heterogeneities of the medium. At the final stage, a bimodal inversion based on the previous stage was used. As a result, a geoelectric section was obtained, the model selection error was about 3 % (Fig.6). In the future, it is planned to refine the section upon obtaining additional information.
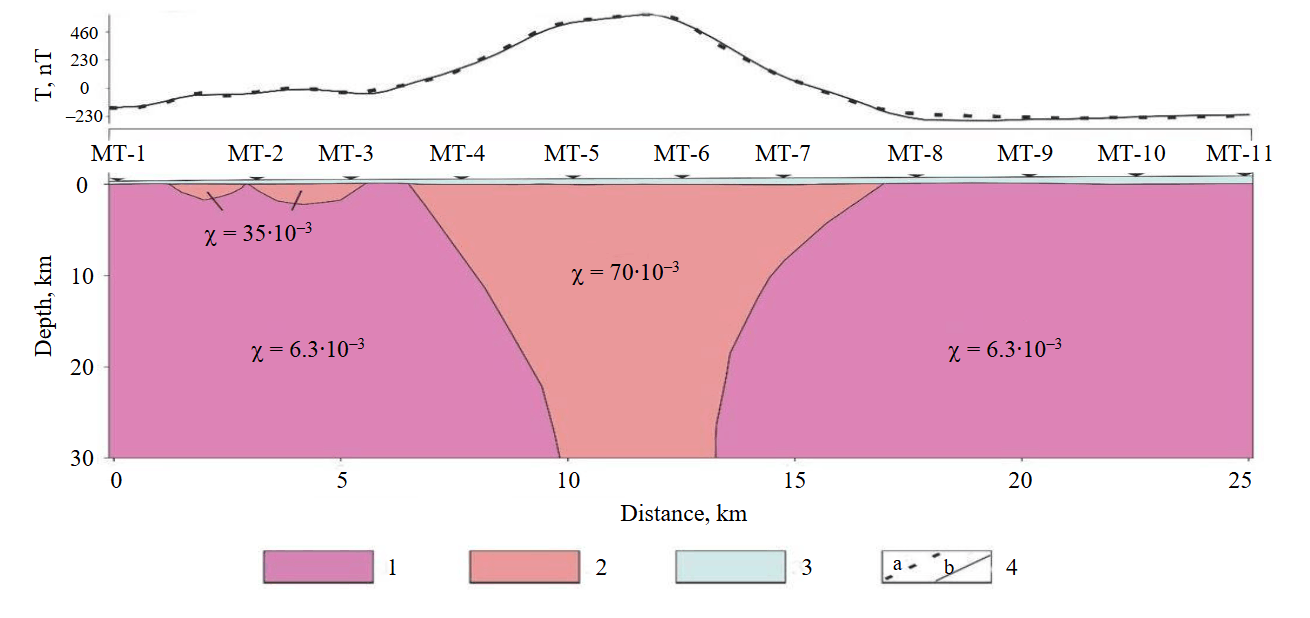
Fig.5. Simulated cross‑section of the Earth’s crust along the survey line based on anomalous magnetic field data
1 – continental crust; 2 – rocks of suture zone; 3 – glacier; 4 – observed (a) and calculated (b) magnetic field
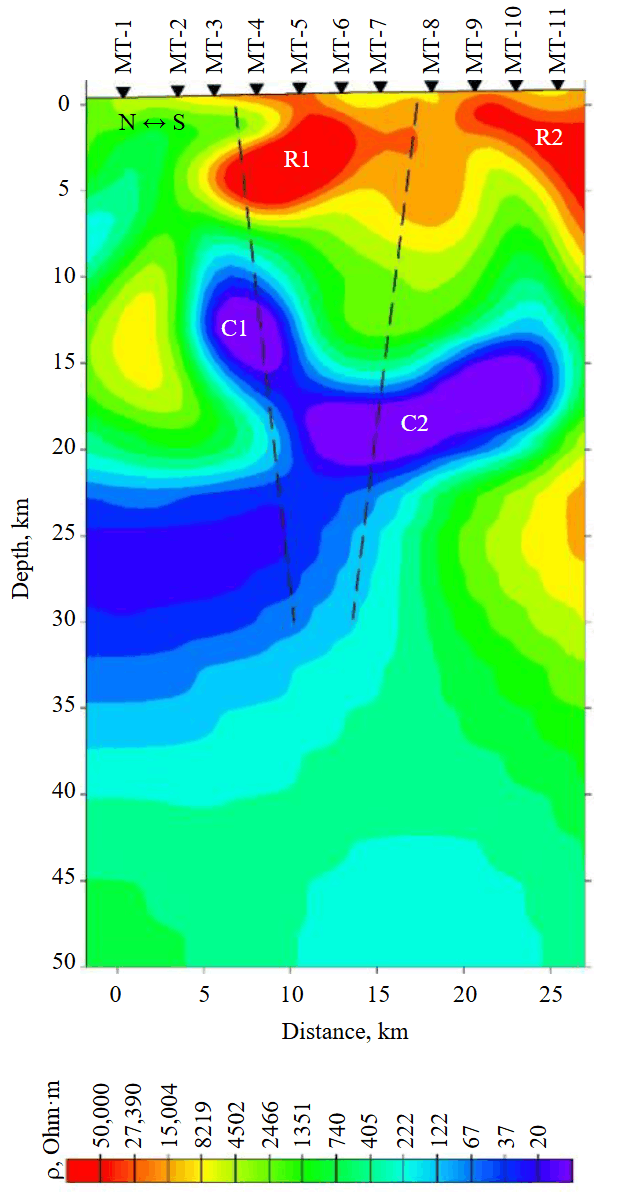
Fig.6. Geoelectric cross‑section along the survey line.
Dashed lines show the inferred deep faults
Analysis of the general structure of the geoelectric section shows that the average resistivity in the northern part, adjacent to the ocean, is lower than in the southern part extending deep into the Antarctic continent. The electrical resistivity section exhibits zones of increased electrical conductivity (C1 and C2) at depths below 10 km. Their nature can be explained by the manifestation of deep tectonic faults feathering the Proterozoic suture zone, the position of which was identified from the results of simulating the anomalous magnetic field data as well as by a high conductivity of sulfide films encountered in this type of metamorphism. In the upper part of the section, position of the suture corresponds to a zone of increased electrical resistivity (R1), which can be accounted for by a combination of low temperatures and rupture of films at grain boundaries under low pressure [16]. In the southern part of the section, an increase in electrical resistivity (R2) is recorded which is associated with high-resistivity rocks of the continental crust of the East Antarctica. In the northern part of the section, at depths 22-35 km, a zone of increased conductivity is distinguished, which the authors interpret as a possible influence of the ocean.
Conclusion
In the course of the work accomplished by the experts from the Saint Petersburg Mining University in the course of the 71st Russian Antarctic Expedition, the magnetotelluric sounding technique was successfully tested in high polar latitudes using active electrodes with preamplifiers. The obtained results confirm the feasibility of conducting the MTS on the surface of snow-firn layers with a high contact resistance value.
A comparison of multi-day magnetotelluric field records obtained using the equipment of the Canadian company Phoenix Geophysics Ltd and the Russian company North-West Ltd was performed. The quality of the curves obtained using the systems of different manufacturers is consistent. Both foreign and Russian equipment can be applied in future work. To optimize the fieldwork technology, it is recommended to use only one type of geophysical equipment. The Russian equipment offers several advantages, such as a universal wide-range induction magnetic field sensor, which allows a simultaneous acquisition of data in the audio-magnetotelluric and magnetotelluric ranges during a single recording, the ability to assess data quality without interrupting the recording, and a more compact size.
Interpretation of the obtained geoelectric section enabled to reveal the features of deep structure of the study area. Deep zones of increased conductivity can represent an anomalous effect of the Proterozoic suture zone and the faults that bound it. A combined analysis of the MTS and magnetic field data confirms the complex structure of the studied object and the potential for further comprehensive study.
References
- Gupta S., Chatterjee S., Arora D. et al. Locating the Indo-Antarctica suture – Correlating the Rengali, Rauer and Ruker terranes in Gondwana. Polar Science. 2021. Vol. 30. N 100689. DOI: 10.1016/j.polar.2021.100689
- Fitzsimons I.C.W. Grenville-age basement provinces in East Antarctica: Evidence for three separate collisional orogens. Geology. 2000. Vol. 28. N 10, p. 879-882. DOI: 10.1130/0091-7613(2000)28<879:GBPIEA>2.0.CO;2
- Wei-(Rz) Wang, Yue Zhao, Chunjing Wei et al. High-Ultrahigh Temperature Metamorphism in the Larsemann Hills: Insights into the Tectono-Thermal Evolution of the Prydz Bay Region, East Antarctica. Journal of Petrology. 2022. Vol. 63. Iss. 2. N egac002. DOI: 10.1093/petrology/egac002
- Golynsky A.V., Ferraccioli F., Hong J.K. et al. New Magnetic Anomaly Map of the Antarctic. Geophysical Research Letters. 2018. Vol. 45. Iss. 13, p. 6437-6449. DOI: 10.1029/2018GL078153
- Stüwe K., Braun H.-M., Peer H. Geology and structure of the Larsemann Hills area, Prydz Bay, East Antarctica. Australian Journal of Earth Sciences. 1989. Vol. 36. Iss. 2, p. 219-241. DOI: 10.1080/08120098908729483
- Sadiq M., Bhandari A., Arora D. et al. Late Neoproterozoic metamorphic evolution of Larsemann Hills, East Antarctica: Insights from pseudosection modelling and monazite-zircon geochronology of Easther Island porphyroblastic gneiss. Journal of Earth System Science. 2024. Vol. 133. Iss. 4. N 238. DOI: 10.1007/s12040-024-02434-9
- Babenko I.A., Talovina I.V., Ushakov D.E., Krikun N.S. Pegmatites of the Larsemann Hills oasis, East Antarctica: new field geological and geophysical data. Journal of Mining Institute. 2025. Vol. 273, p. 65-79.
- Abdrakhmanov I., Leitchenkov G., Skublov S. et al. Neoproterozoic crustal evolution of Rayner province, East Antarctica: New insight from subglacial drilling. Polar Science. 2026. Vol. 47. N 101314. DOI: 10.1016/j.polar.2025.101314
- Hessler V.P., Jacobs J. A Telluric Current Experiment on the Antarctic Ice Cap. Nature. 1966. Vol. 210, p. 190-191. DOI: 10.1038/210190a0
- Hill G.J. On the Use of Electromagnetics for Earth Imaging of the Polar Regions. Surveys in Geophysics. 2020. Vol. 41. Iss. 1, p. 5-45. DOI: 10.1007/s10712-019-09570-8
- Pritchard H.D., Fretwell P.T., Fremand A.C. et al. Bedmap3 updated ice bed, surface and thickness gridded datasets for Antarctica. Scientific Data. 2025. Vol. 12. N 414. DOI: 10.1038/s41597-025-04672-y
- Davydkina T.V., Yankilevich A.A., Naumova A.N. Specifics of magnetotelluric studies in Antarctica. Journal of Mining Institute. 2025. Vol. 273, p. 80-93.
- Hill G.J., Wannamaker P.E., Maris V. et al. Trans-crustal structural control of CO2-rich extensional magmatic systems revealed at Mount Erebus Antarctica. Nature Communications. 2022. Vol. 13. N 2989. DOI: 10.1038/s41467-022-30627-7
- Wannamaker P.E., Stodt J.A., Olsen S.L. Dormant state of rifting below the Byrd Subglacial Basin, West Antarctica, implied by magnetotelluric (MT) profiling. Geophysical Research Letters. 1996. Vol. 23. Iss. 21, p. 2983-2986. DOI: 10.1029/96GL02887
- Wannamaker P.E., Stodt J.A., Pellerin L. et al. Structure and thermal regime beneath the South Pole region, East Antarctica, from magnetotelluric measurements. Geophysical Journal International. 2004. Vol. 157. Iss. 1, p. 36-54. DOI: 10.1111/j.1365-246X.2004.02156.x
- Peacock J.R., Selway K. Magnetotelluric investigation of the Vestfold Hills and Rauer Group, East Antarctica. Journal of Geophysical Research: Solid Earth. 2016. Vol. 121. Iss.4, p. 2258-2273. DOI: 10.1002/2015JB012677
- Wannamaker P., Hill G., Stodt J. et al. Uplift of the central transantarctic mountains. Nature Communications. 2017. Vol. 8. N 1588. DOI: 10.1038/s41467-017-01577-2
- Gustafson C.D., Key K., Siegfried M.R. et al. A dynamic saline groundwater system mapped beneath an Antarctic ice stream. Science. 2022. Vol. 376. N 6593, p. 640-644. DOI: 10.1126/science.abm3301
- Lei Fu, Jingxue Guo, Weisen Shen et al. Geophysical Evidence of the Collisional Suture Zone in the Prydz Bay, East Antarctica. Geophysical Research Letters. 2024. Vol. 51. Iss. 2. N e2023GL106229. DOI: 10.1029/2023GL106229
- Jingxue Guo, Enzhao Xiao, Juzhi Deng et al. Electrical Structures of the Lithosphere Along the Prydz Belt: Magnetotelluric Study at Chinese Zhongshan Station, East Antarctica. Arabian Journal for Science and Engineering. 2022. Vol. 47. Iss.1, p. 695-707. DOI: 10.1007/s13369-021-05793-3
- Enzhao Xiao, Feng Jiang, Jingxue Guo et al. 3D Interpretation of a Broadband Magnetotelluric Data Set Collected in the South of the Chinese Zhongshan Station at Prydz Bay, East Antarctica. Remote Sensing. 2022. Vol. 14. Iss. 3. N 496. DOI: 10.3390/rs14030496
- Talovina I.V., Babenko I.A., Ilalova R.K., Duryagina A.M. Olivine-spinel geothermometry – Indicator of formation identity of rocks and a basis for geodynamic reconstructions in Antarctica. Gornyi zhurnal. 2024. N 9, p. 77-82 (in Russian). DOI: 10.17580/gzh.2024.09.12
- Ignatiev S.A., Vasilev D.A., Bolshunov A.V. et al. Experimental Research of Ice Cuttings Transport by Air While Drilling of the Snow-Firn Layer. Ice and Snow. 2023. Vol. 63. N 1, p. 141-152 (in Russian). DOI: 10.31857/S2076673423010076
- Litvinenko V., Trushko V. Modelling of geomechanical processes of interaction of the ice cover with subglacial Lake Vostok in Antarctica. Antarctic Science. 2025. Vol. 37. Iss. 1, p. 39-48. DOI: 10.1017/S0954102024000506
- Shibayev Yu.A., Tchikhatchev K.B., Lipenkov V.Ya. et al. Seasonal variations of snowpack temperature and thermal conductivity of snow in the vicinity of Vostok station, Antarctica. Problemy Arktiki i Antarktiki. 2019. Vol. 65. N 2, p. 169-185 (in Russian). DOI: 10.30758/0555-2648-2019-65-2-169-185
- Epishkin D.V. Improving magnetotelluric data processing methods. Moscow University Bulletin. Series 4. Geology. 2016. N 4, p. 40-46 (in Russian). DOI: 10.33623/0579-9406-2016-4-40-46
- Feldman I.S., Ermolin E.U. Amplitude-phase correction of magnitotellurie impedance curves. Journal of Mining Institute. 2011. Vol. 194, p. 200-210 (in Russian).
- Zorin N., Aleksanova E., Yakovlev D., Shimizu H. Validity of the dispersion relations in magnetotellurics: Part I – theory. Earth, Planets and Space. 2020. Vol. 72. N 9. DOI: 10.1186/s40623-020-1133-4
- Zorin N., Alekseev D., Epishkin D. et al. Validity of the dispersion relations in magnetotellurics. Part II: synthetic and field data. Earth, Planets and Space. 2020. Vol. 72. N 139. DOI: 10.1186/s40623-020-01273-4
- Berdichevsky M.N., Dmitriev V.I. Models and Methods of Magnetotellurics. Moscow: Nauchnyi mir, 2009, p. 680 (in Russian).
- Kalinin D.F., Dolgal A.S., Voroshilov V.A. Probabilistic Analysis of Geological and Structural Prospects for Oil and Gas Potential in Western Yakutia Using Three-Dimensional Empirical Mode Decomposition of Potential Fields. Georesursy. 2024. Vol. 26. N 2, p. 53-68 (in Russian). DOI: 10.18599/grs.2024.2.6
- Yakovleva A.A., Movchan I.B., Medinskaia D.K., Sadykova Z.I. Quantitative interpretations of potential fields: from parametric to geostructural recalculations. Bulletin of the Tomsk Polytechnic University. Geo Assets Engineering. 2023. Vol. 334. N 11, p. 198-215 (in Russian). DOI: 10.18799/24131830/2023/11/4152
- Zharkov A.M., Peskov D.V., Martynov A.V. Identification of Hydrocarbon Accumulation Zones on Ancient Platforms in the Northern Part of Eurasian Lithospheric Plate. International Journal of Engineering, Transactions B: Applications. 2025. Vol. 38. Iss. 11, p. 2713-2727. DOI: 10.5829/ije.2025.38.11b.19
- Sekerina D.D., Saitgaleev M.M., Senchina N.P. et al. Role of strike-slips and graben-rifts in controlling oil and gas reservoirs in deep horizons of the Russko-Chaselsky Ridge (West Siberian Province). Mining Science and Technology. 2025. Vol. 10. N 2, p. 109-117. DOI: 10.17073/2500-0632-2025-02-399
- Prischepa O.M., Sinitsa N.V. Prospects for Oil and Gas Bearing Potential of Paleozoic Basement of West Siberian Sedimentary Basin. International Journal of Engineering, Transactions B: Applications. 2025. Vol. 38. Iss. 5, p. 1098-1107. DOI: 10.5829/ije.2025.38.05b.12