
An optimization technique based on mechanical specific energy concept to improve drilling efficiency: a case study
- 1 — Researcher Sahand University of Technology ▪ Orcid
- 2 — Ph.D. Assistant Professor Sahand University of Technology ▪ Orcid
Abstract
For years attempts have been made in the drilling industry to increase the drilling efficiency and decrease the associated costs. The drilling efficiency can be evaluated by comparing applied energy, i.e., mechanical specific energy, with rock strength. The mechanical specific energy is defined as the energy required to destroy a unit volume of the rock. Over the years, this concept has been refined, and researchers proposed various models. Mechanical specific energy directly affects drilling efficiency, as excessive energy can lead to drill string vibrations and bit wear. In this study, a database was established by collecting drilling and log data from the Asmari formation in one of the oil fields of Iran. Various forms of specific energy were examined to develop the appropriate model based on operational conditions and the formation being drilled. Additionally, the confined compressive strength of the rock in the studied well was calculated. The results showed that the developed specific energy model provides a realistic energy value, as it includes all relevant parameters with an output close to the rock strength. Based on the comparison of mechanical specific energy with confined compressive strength, the optimal drilling parameters were determined: weight on bit ranges from 22.24 to 44.48 kN, flow rate ranges from 0.027 to 0.029 m3/s, torque ranges from 2522 to 3091 N·m, and rotational speed ranges from 160 to 180 rpm. Also, an inefficient drilling zone was identified in the studied well, where excessive applied energy compared to rock strength led to the drill bit damage and a significant reduction in penetration rate. The results highlighted the importance of drilling efficiency estimation in the drilling process, where an economic and technically feasible decision can be made by comparing the surface input energy with the rock strength.
None
Introduction
The goal of drilling optimization is to balance the applied surface energy and the required energy for rock destruction. It is noteworthy that part of the applied energy from the surface is usually lost because of vibrations and oscillations in the drill string and does not contribute to the rock destruction process. In this regard, various research and experimental studies have been conducted to reduce undesirable forms of applied energy and establish a balance between applied and required energies [1, 2].
The first study about applied surface energy in the drilling operation was conducted by R.Teale in 1965. In the research, Mechanical specific energy (MSE) was introduced as the energy required to destroy and drill a unit volume of the rock. This initial model included two parts related to axial force due to the weight of the drill string on the bit and the torque generated by the drill string rotation [3]. The initial model was optimized and changed in subsequent studies based on various operational and geological conditions in the drilling process [4]. In present MSE forms, the effects of different parameters such as rock mechanical properties, operational parameters, and drilling fluid characteristics are incorporated into the Teale initial MSE model [5-7].
Between 1960 and 2000, in the early models of MSE, such as the Teale and Rabia, only the effects of surface parameters and drilling rig-related factors were considered. During this period, the impacts of hydraulic parameters of the drilling fluid and formation characteristics were generally ignored, while studies have shown the significance of drilling fluid rheological properties on the drilling efficiency [8, 9].
These models were primarily focused on simplifying the analysis of drill string movement and neglected aspects such as bit wear or the rheological properties of the drilling fluid. This perspective changed with technological advancements and the increasing complexity of drilling operations beyond the 2000s [5, 10, 11]. In the early 2000s, researchers tried to improve MSE models and investigate the impact of additional factors. For example, the models proposed by Dupriest and Koederitz utilized the concepts of mechanical efficiency and the rock confined compressive strength (CCS), representing a significant advancement in the evolution of MSE models. However, subsequent research demonstrated that the CCS of the rock alone could not fully represent the impact of rock properties on specific energy. Other parameters, such as lithology, shear strength, hardness, and porosity, also influence the magnitude of MSE [5, 12, 13].
Since the late 2000s, researchers have focused on integrating drilling hydraulic parameters into MSE models. For example, the models proposed by M.Armenta and K.Mohan considered hydraulic parameters to be a significant factor. Integrating hydraulic parameters has provided more detailed information on drilling fluid characteristics and their effects on MSE. This development not only improved the accuracy of the models but also enhanced the predictive capability and adaptability to different drilling conditions [14-16]. In newer models [17-19] the effects of nearly all surface parameters related to the rig and the drilling fluid hydraulics were considered. Additionally, these models accounted for the impact of the well inclination and, if downhole motors were used, the influence of the motor parameters as well. Downhole motors have shown optimized drilling efficiencies in vertical and directional sections [20, 21].
If the MSE is excessively high, it can lead to drill string vibrations, bit destruction, reduced penetration rate, and may eventually result in equipment wear and fatigue [22]. According to the previous studies, the minimum applied MSE should be equal to the CCS of the rock [3, 23, 24]. Several studies in the context of drilling optimization used the MSE concept. F.E.Dupriest et al. [11] discovered that if the ratio of MSE to the rock volume remains constant or relatively constant, the drill bit operates at peak drilling efficiency. The authors also showed that if the MSE remains steady as the weight on the bit increases, the bit performance is efficient. However, if the MSE does not remain constant and increases, it indicates that the bit is inefficient, and the drilling performance has deviated from the effective drilling zone.
M.Armenta [12] demonstrated that inefficient drilling occurs when the specific energy increases and the penetration rate decreases. According to his findings, the specific energy increases when the weight on the bit exceeds a certain threshold. He also defined the boundary between efficient and inefficient drilling operations.
N.Rafatian et al. [13] experimentally investigated the MSE variation during drilling with synthetic diamond bits. The results revealed that even a slight increase in confining pressure significantly raises the energy required to destroy both permeable and impermeable rocks, potentially reducing drilling efficiency. Their study showed that the rise in MSE is much more pronounced in the confining pressure range 0-1.034 MPa compared to the range of 1.034-6.55 MPa.
I.J.Thomson and R.Mathur [14] improved drilling performance in a deep-water offshore project by monitoring and analyzing surface and downhole MSE data and combining them with downhole drilling parameters. Because the drill string often experiences vibrations when the bit moves from a soft formation to a more complex formation, authors utilized real-time drilling data and MSE monitoring to predict these transition zones. Therefore, a quick response could be recorded by the drilling crew to adjust the drilling parameters and hold the operation efficiently.
C.Hammoutene [15] optimized the drilling operation by comparing MSE and UCS. He considered the mechanical efficiency factor for synthetic diamond bits to be between 0.26 and 0.64. This efficiency factor was used to improve bit design and enhance the rock destruction process, ensuring that factors such as sudden subsurface formation changes, formation heterogeneity, and vibrations would not threaten the efficiency of drilling operation.
B.M.Mohammadi et al. [19] examined the impact of geomechanical parameters on specific energy variations in one of the oil fields in southwestern Iran. They first collected geological, log, drilling, core, and pore pressure data from various wells to construct a one-dimensional geomechanical model. Then, a multivariable regression model was used to establish a relationship between specific energy and its influencing parameters. The researchers found that parameters such as UCS, internal friction angle, and flow rate are among the most significant factors affecting specific energy.
S.Menand and K.Mills [25] discovered that MSE alone cannot fully determine the drilling inefficiency. They introduced a new method combining MSE with the drilling strength index to identify the causes of drilling inefficiencies better. Case studies demonstrated that the ratio of MSE to drilling strength can help detect specific challenges and inefficiencies in drilling, such as slip-stick phenomena and bit wear.
V.Ramba et al. [26] conducted a study to optimize the drilling parameters and increase the penetration rate in an exploration well. By monitoring the plotted graphs of MSE and penetration rate, they identified efficient and inefficient drilling zones. Similarly, by examining the graphs of specific energy and rate of penetration, they calculated the optimal drilling fluid flow rate required. By implementing the optimized drilling parameters, they achieved a 75 % reduction in the applied energy.
Among the influencing factors, the bit design also can change the MSE value. C.Xiong et al. [16] investigated the effects of cutting depth, cutting angle, and cutting speed of a stinger polycrystalline diamond compact bit on MSE variations. Their results indicated that the MSE significantly decreases with increasing cutting depth, while the cutting speed has a minor effect on MSE value.
As can be seen, in different studies, various MSE models with specific modifications are utilized for drilling optimization, and there is not universally accepted MSE model. In this research, geological, log, and drilling data were collected from a well in an onshore field, and various MSE models were investigated based on the actual data. As a result, a modified equation for the field under study was proposed. Then, the modified MSE model was used to detect the inefficient drilling zones. Therefore, necessary changes in the controllable drilling parameters could be made to optimize the drilling operation.
Methods
The purpose of drilling operations is to break and fragment rocks of subsurface formations. During this process, by applying energy from the surface, a unit volume of rock is converted into smaller pieces of different sizes, and the rock is destroyed. Therefore, a simple definition of the concept of MSE can be considered as the ratio of the input energy to the unit volume of rock destroyed [3, 13]:
The MSE can be defined as the energy required to drill a volume unit of rock [3]. The applied surface energy can include axial, hydraulic, and torsional components. By considering these components, the definition of the MSE can be expressed more comprehensively as follows [2, 18]:
The equation (1) has been modified in different models based on various operational and geological conditions during the drilling process. The first model was presented by R.Teale [3] as the energy required to destroy, remove, and drill a volume unit of rock, which consisted of two parts of applied axial and rotational energies as follows:
where, et is the applied axial energy; er is the rotational energy.
By considering these types of energies, R.Teale presented the model as follows:
where Ab is the bit area; RPM is the rotational speed; T is the torque; ROP is the rate of penetration; WOB is the weight on the bit.
Pessier and Fear conducted experiments on a simulated rig and considered the torque at the bit as a main input for MSE calculation. Researchers pointed out that the surface torque recorded during the drilling is not a suitable indicator of the actual torque at the bit. Therefore, they introduced a bit-specific sliding friction coefficient as a function of the ratio of surface torque applied to the weight on the bit and the bit diameter. The sliding friction coefficient can estimate the torque at the bit when subsurface torque measurements are unavailable [24]. Considering the sliding friction coefficient, the MSE can be calculated as:
where µb is the bit sliding friction coefficient; db is the bit diameter, according to Armenta's research [12], the value of this coefficient is 0.25 for roller cone and 0.5 for polycrystalline diamond compact bits.
F.Dupriest et al. [27] highlighted the importance of MSE monitoring for drilling process optimization. Based on the bit performance examination from field data, the research suggested a maximum bit efficiency of 40 % with an average value of 35 %, regardless of bit type. Therefore, researchers modified the MSE model. The results showed that the values of MSE from equation are roughly equal to the confined compressive strength of the rock:
M.Armenta [12], considering the impact of drilling fluid hydraulic energy in the MSE model, introduced the concept of drilling specific energy as follows:
where λ is the bit hydraulic coefficient, dependent on the bit diameter; HPb is the bit hydraulic power.
The bit hydraulic coefficient can be determined based on the size of the bit used during the drilling operation [12]. In medium to soft rocks, drilling fluid hydraulic energy can weaken the formation before the bit contacts it [18]. K.Mohan et al. [2, 18], considering the impact of drilling fluid hydraulic force, introduced the concept of hydromechanical specific energy (HMSE). The authors stated that when the fluid impacts the formation, an equal and opposite force is exerted on the bit and presented the HMSE as follows:
where WOBe is the effective weight on the bit; ΔPb is the pressure differential at the bit; η is the energy reduction coefficient; Q is the flow rate.
O.Oloruntobi et al. [7] criticized the HMSE model and highlighted the lack of normal pore pressure gradient and equivalent drilling fluid circulation density (MW) in the MSE calculation. Therefore, they propose to extend the HMSE model as follows:
where NPPG is the normal pore pressure gradient; ECD is the equivalent drilling fluid circulation density; MW is the drilling fluid density; TFA is the total flow area of the nozzles; JSA is the junk slot area, as the space where drill cuttings accumulate.
Optimization of the drilling energy in terms of applied surface energy is considered the main application of the MSE concept [4]. The efficiency of drilling operations can be reflected by examining the ratio of the applied MSE to the rock CCS [10, 23, 24]. Introducing excessive than required energy can lead to numerous problems, including vibrations in the drill string, increased bit wear, and reduced ROP. Therefore, balancing the applied MSE and the rock CCS is crucial to ensure optimal drilling performance [28]. Studies have shown that using UCS instead of rock CCS does not yield correct results. If drilling is considered under atmospheric conditions, then the value of MSE relates to the rock UCS. However, under actual drilling conditions, the value of MSE approximates the rock CCS and is generally much higher than the rock UCS. Therefore, optimal conditions for drilling operations are achieved when all the energy is used for destroying the rock, with no noticeable energy loss or inefficiency [4, 17, 29], and the strength of the rock serves as a reference for energy expended in drilling [18, 19, 30]. Based on this, the mechanical efficiency of drilling operations can be represented as follows:
Generally, as the MSE approaches the confined compressive strength of the rock, the mechanical efficiency increases [23, 24, 27]. One of the widely accepted relationships in rock mechanics for calculating CCS is developed based on Terzaghi's principle and the Mohr – Coulomb criterion [10]:
where φ is the internal friction angle of the rock, and ∆P is the differential pressure between the drilling fluid pressure and the pore pressure.
Various empirical relationships are proposed to calculate the UCS based on its lithology. Table 1 shows several common relationships to calculate UCS for carbonate, limestone, and dolomitic rocks.
Table 1
The relationships for calculation of rock UCS [31-33]
|
Type of formation lithology |
Researchers |
Equation |
Required parameters |
|
Carbonate |
Rezhevsky, Novick (1971) |
|
Porosity |
|
Limestone |
Militzer, Stoll (1973) |
|
Compressional wave velocity |
|
Golubev, Rabinovich (1976) |
|
||
|
Carbonate |
Sarda et al. (1993) |
|
Porosity |
|
Farquhar et al. (1994) |
|
||
|
Limestone, dolomite, marl, sandstone, hematite, tuff, diabase |
Christaras et al. (1997) |
|
Compressional wave velocity |
|
Carbonate |
Edimann et al. (1998) |
|
Porosity |
|
Yasar et al. (2004) |
|
Compressional wave velocity |
|
|
Limestone, dolomite |
Chandong et al. (2006) |
|
Compressional wave transit time |
|
Carbonate |
|
||
|
Limestone |
|
Dynamic Young's modulus |
|
|
Dolomite |
|
||
|
Carbonate |
|
Porosity |
|
|
|
|||
|
Limestone |
Ameen et al. (2007) |
|
|
|
Dolomite |
|
||
|
Carbonate rock with shale laminations |
Afsari et al. (2010) |
|
Static Young's modulus |
|
Carbonate |
Amani et al. (2013) |
|
Compressional wave transit time |
|
|
Compressional wave transit time and porosity |
||
|
Carbonate |
Najibi et al. (2015) |
|
Static Young's modulus |
|
|
Dynamic Young's modulus |
||
|
|
Compressional wave velocity |
As Table 1 shows, Young's modulus is an input for UCS calculation in many equations. Also, according to equation (7), the internal friction angle is required for CCS calculation. Table 2 present common empirical relationships for calculating Young's modulus and internal friction angle [34-36].
Table 2
Empirical relationships for Young's modulus calculation [34-36] and internal friction angle calculation [37-39]
|
Type of formation lithology |
Researchers |
Equation |
Required parameters |
|
Young's modulus calculation |
|||
|
Carbonate
|
Eissa et al. (1988) |
|
Dynamic Young's modulus |
|
|
Dynamic Young's modulus, density |
||
|
Edimann et al. (1998) |
|
Porosity |
|
|
Dolomite |
Ameen et al. (2007) |
|
|
|
Limestone |
|
||
|
General |
Fjaer et al. (2008) |
|
Density, compressional wave velocity, shear wave velocity |
|
Carbonate |
Afsari et al. (2010) |
|
Dynamic Young's modulus |
|
Asmari and Sarvak |
Najibi et al. (2015) |
|
|
|
|
Compressional wave velocity |
||
|
Internal friction angle calculation |
|||
|
Limestone |
Edimann (1998) |
|
Porosity |
|
Carbonate |
Archer et al. (2012) |
|
Porosity, shale volume |
In this study, first, data was collected and processed, and an optimum MSE model for the field under study was developed. Then, inefficient drilling zones were determined by comparing the MSE with the rock CCS. Furthermore, the relationships between different drilling parameters were analyzed to conclude about the optimization of controllable drilling variables.
To this research, next steps are followed: the required drilling data were collected and processed in the first step. The drilling data were then used in the optimum MSE model. Also, the data obtained from petrophysical logs were extracted and processed using Geolog software. After making the necessary corrections to the raw logs, these data were organized and classified to estimate the CCS. Finally, the calculated MSE and CCS values were compared to conclude about the drilling process's effectiveness.
The field studied in this research is one of Iran's largest onshore oil fields, located in the southwestern part of the country, with a total depth of 4130 m. The data of the study were extracted from reports related to one of the wells. The reports included daily drilling reports (DDR), mud-logging reports, drilling bit records, and petrophysical logs.
In the studied well, log data was only available in the reservoir section, Asmari formation, i.e., the depth range of 3840 to 4100 m. Therefore, the study was limited to this depth range, as the log data are essential for CCS calculation. The Asmari formation, as the main reservoir in the field, is subdivided into six distinct layers, primarily composed of dolomitic carbonates, shale, and marl.
After drilling data collection, they were statistically described for better understanding and identifying outliers and meaningless values. Table 3 shows the descriptive statistics for the drilling parameters.
Table 3
Descriptive statistical analysis of the drilling parameters
|
Statistical indicators |
WOB, kN |
T, kN·m |
RPM, rpm |
ROP, m/h |
Q, m3/s |
MW, kg/m3 |
|
Mean value |
7702.5 |
1949.6 |
160.6 |
10.8 |
458.2 |
9 |
|
Median |
7204.5 |
2032.2 |
176.2 |
10.6 |
456 |
9.1 |
|
Mode |
0 |
0 |
0 |
15.6 |
0 |
9.1 |
|
Standard deviation |
3425.5 |
325 |
35.9 |
6.7 |
18.8 |
0.2 |
|
Variance |
11,733,791.8 |
105,650 |
1291.1 |
44.8 |
353.1 |
0.03 |
|
Minimum |
1719.4 |
942.7 |
55.4 |
1.6 |
368.3 |
7.5 |
|
Maximum |
22,642.1 |
2539.3 |
185.6 |
95.1 |
511.3 |
9.5 |
The log data were also collected and sorted in the Geolog software. Specifics of the log data in the studied well by log type (top logging depth 3840 m; bottom logging depth 4115 m; logging step 0.1 m): CALI – well diameter; PE – photoelectric factor; HDRS – deep resistivity; HMRS – medium resistivity; NPHI – neutron; RHOB – density; DRHO – corrected density; POTA – potassium; THOR – thorium; URAN – uranium; SGR – gamma with thorium and potassium elements; CGR – gamma with thorium, potassium, and uranium elements; GR – gamma; DT – compressional wave transit time.
Drilling and log data are usually acquired using special sensors and gauges. Therefore, they may be subjected to some errors, i.e., values among the collected data that are unacceptable and need to be removed from the database. For example, due to axial vibrations of the drill string, WOB values much larger than the permissible limit (considering the limitations related to the size and type of the bit and the length of the drill string) may be recorded. Therefore, it is essential to remove these outlier data from the database. Outliers are observations that are numerically distant from the other data points. There are several methods for this purpose, and in this study, the box plot method has been applied to remove statistical outliers. A box plot is a very useful tool for data analysis, which provides a graphical representation of the distribution of the data, enabling an intuitive comparison of statistical parameters. This plot allows for a clear view of the dispersion and skewness of the data at a glance. In addition, the box plot provides the ability to identify areas with higher or lower accumulation of data [40, 41]. When examining a box plot, points outside the lower and upper boundary lines are identified as outliers.
In this research, using the drilling and log data, common MSE models, i.e., Teale, Pessier and Fear, Dupriest and Koederitz’s, DSE, and HMSE were calculated and compared together. According to Teale’s model, the MSE is affected by parameters such as WOB, bit area, rotational speed, torque, and ROP. In Pessier and Fear’s model, the MSE was calculated using the standard value for the sliding friction coefficient, as suggested by M.Armenta, for the types of bits used in the well under study. Based on this, for the depth intervals where button bits were used, a friction coefficient value of 0.25 was considered, while for the intervals where polycrystalline diamond compact bits were used, a friction coefficient value of 0.5 was applied.
In Dupriest and Koederitz's refined model, the MSE was calculated according to equation (4). In the model, drilling mechanical efficiency is also included as an important parameter, which is set to 0.35 according to Dupriest and Koederitz's suggestion. However, other values may be recommended in different geological and operational conditions [10, 11, 15].
To calculate the DSE, the formula provided by M.Armenta (5) was used. In the equation, in addition to the drilling parameters mentioned in Teale's initial model, the drilling specific energy depends on other critical parameters that were ignored in the previous models, such as the flow rate of the drilling fluid and the mud weight. Also, the coefficient for the bit hydraulics effects was determined to be 0.018 [12].
The complete HMSE model was calculated using equation (6). This model includes all energy components, i.e., the axial, rotational, and hydraulic energy of the drilling fluid. In addition to the drilling parameters, the pore pressure gradient and equivalent circulating density were also entered into the model.
Regarding the lithological characteristics of the target formation, a set of empirical relations was used to estimate the mechanical and strength properties of the rock (Table 4). These equations also were used to calculate compressional and shear wave velocities. The lithology of the Asmari formation was determined using the neutron-density cross-plot (Fig.1), the bottom line (density of 2.6 g/cm3), the middle line (density of 2.71 g/cm3), and the top line (density of 2.87 g/cm3) are related to sandstone, limestone, and dolomite, respectively. Geolog software defines and plots these lines using the neutron log tool (Dual Spaced Neutron II), which was run in the studied well. Given the distribution of points between the density lines for limestone and dolomite, the lithology of the Asmari formation falls into the carbonate group, indicating a combination of limestone and dolomite.
Table 4
Empirical relationships to determine the rock's mechanical and strength properties [34, 35, 38]
|
Parameter |
Equation |
Researchers |
|
Internal friction angle |
|
Archer and Rasouli (2012) |
|
Compressional wave velocity |
|
– |
|
Shear wave velocity |
|
Castagna (1985) |
|
Dynamic Young's modulus |
|
Fjaer et al. (2008) |
|
Static Young's modulus |
|
Najibi et al. (2015) |
|
Unconfined compressive strength |
|
Najibi et al. (2015) |
|
Confined compressive strength |
|
Caicedo et al. (2005) |
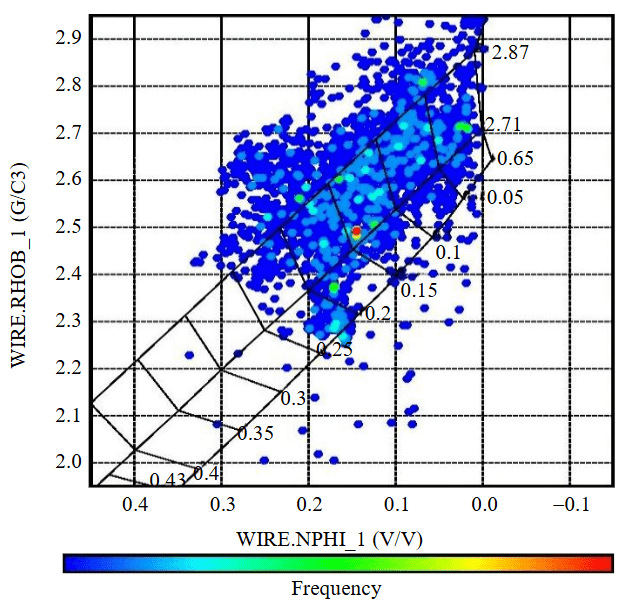
Fig.1. Neutron-density cross plot curve for determination of the lithology
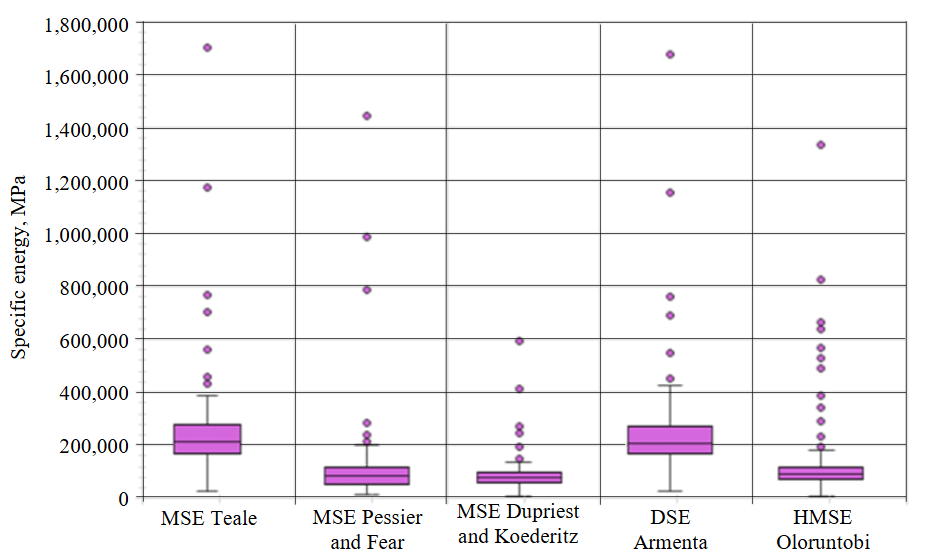
Fig.2. Statistical outliers for MSE models
Discussion
When the MSE approaches the CCS of the rock, it is within the optimal range, indicating that the controllable drilling parameters have been correctly selected. This section presents a detailed analysis of the data collected, with a particular emphasis on the assessment of the MSE values and their variations with depth. This comprehensive understanding of the drilling conditions was crucial for efficient operations. Then, the inefficient drilling zones were determined by comparing the calculated MSE along the well and their optimal value (equal to the rock CCS). After that, the relationship between MSE, ROP, and other drilling parameters was analyzed to better describe the drilling condition in the studied well.
After collecting the drilling data, the MSE models were calculated using equations (2)-(6), and then the outliers were removed based on the box plot method. Fig.2 displays a box plot for identifying outliers in calculated MSE values. Data points too high or lower than the chart represent outliers. According to Fig.2, the calculated MSE models by Teale, Pessier and Fear, and DSE exhibited the highest number of outliers. Table 5 shows the upper boundary, lower boundary, first quartile, third quartile, total number of points, and outlier points for the MSE models.
Table 5
Lower and upper boundary limits for MSE models and the number of outliers, МPа
|
Specification |
MSE model |
||||
|
Teale |
Pessier and Fear |
Dupriest and Koederitz |
DSE |
HMSE |
|
|
The first quartile |
171,132.9 |
55,558.7 |
59,896.5 |
167,835.2 |
72,126.8 |
|
The third quartile |
275,714.1 |
118,843.4 |
96,499.9 |
271,835.4 |
119,711 |
|
The lower boundary |
14,261.1 |
39,368.3 |
4991.4 |
11,834.9 |
750.5 |
|
The upper boundary |
432,585.9 |
213,770.5 |
151,405.1 |
427,835.7 |
191,087.4 |
|
Total points |
261 |
261 |
261 |
261 |
261 |
|
Outlier points |
12 |
7 |
12 |
11 |
30 |
|
Remaining points |
249 |
254 |
249 |
250 |
231 |
The variations of MSE versus depth were plotted (Fig.3) with and without outlier removal. As shown, the MSE values from the Teale and DSE models are very close to each other, overlapping almost completely. However, the Pessier and Fear, the Dupriest and Koederitz and HMSE models exhibit lower MSE values, suggesting a more optimal condition.
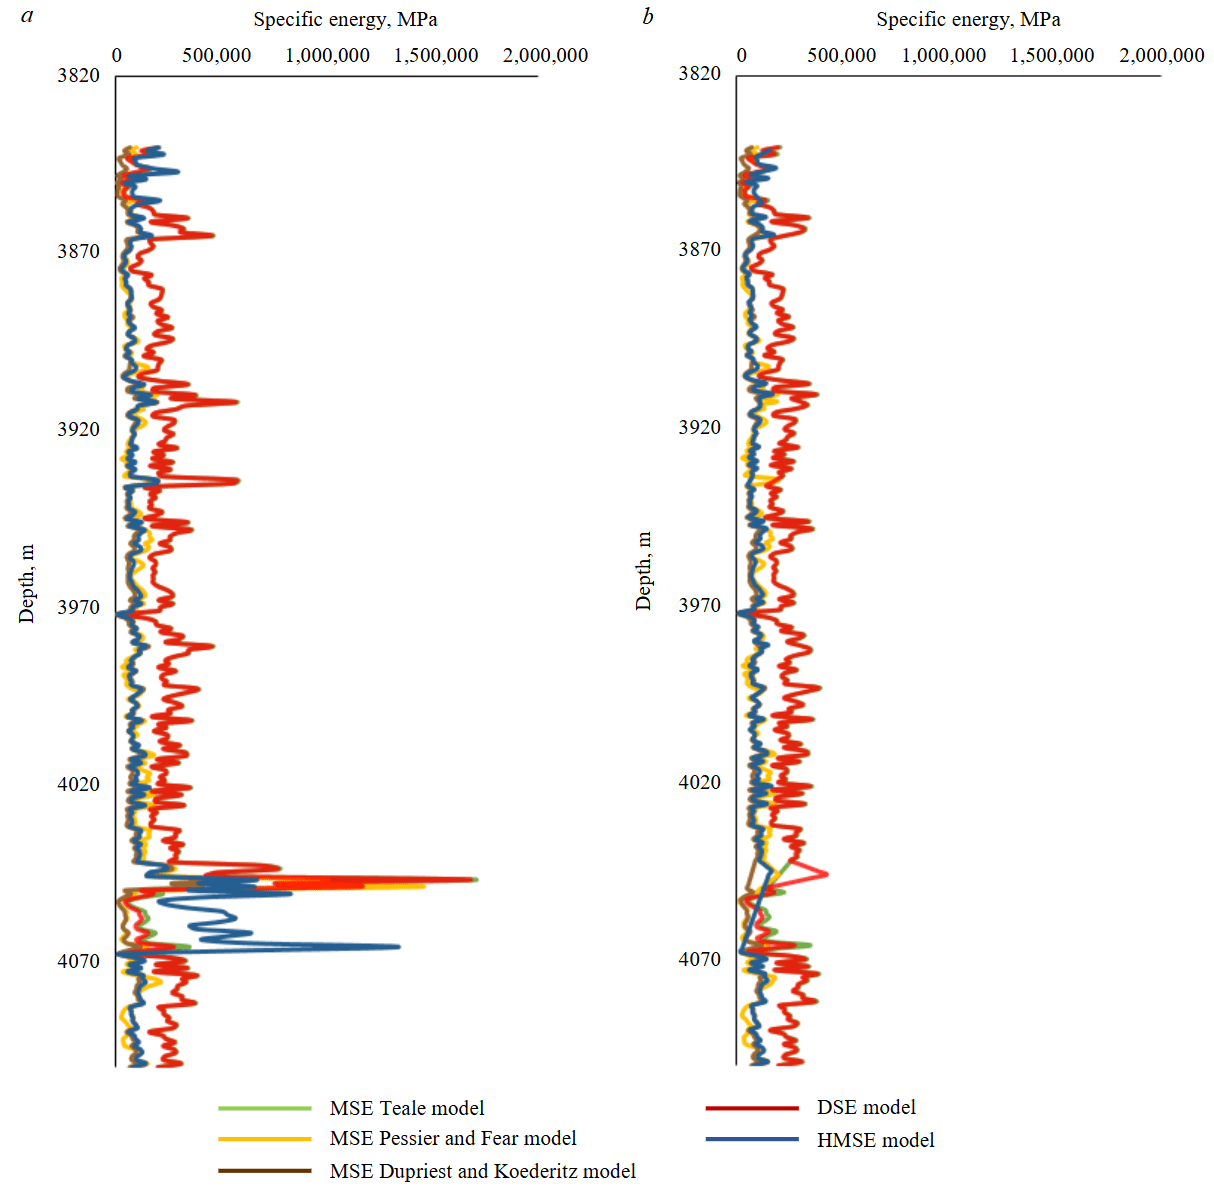
Fig.3. MSE versus depth when outliers are not removed (a); when outliers have been removed (b)
The HMSE model includes all energy components, i.e., axial, rotational, and hydraulic energies, providing a more accurate representation of applied surface energy compared to the other models. On the other hand, as seen in Fig.3, the Dupriest and Koederitz model provides a more optimal representation of MSE compared to other models due to the mechanical efficiency factor. Therefore, in this research, a combination of these two models was proposed for MSE calculation in the studied well as follows:
MHMSE, which was developed in this study, is a special MSE model that considers both the effects of mechanical efficiency and hydraulic energy factors. The MHMSE has the lowest possible value compared to other MSE models, providing an optimal representation of applied surface energy. Figure 4 shows the rock's unconfined and confined compressive strengths (Fig.4, a), static and dynamic Young's modulus (Fig.4, b), shear and compressional wave velocities (Fig.4, c), and the internal friction angle (Fig.4, d). The CCS will be compared to the MHMSE to identify the zones where the drilling is considered inefficient.
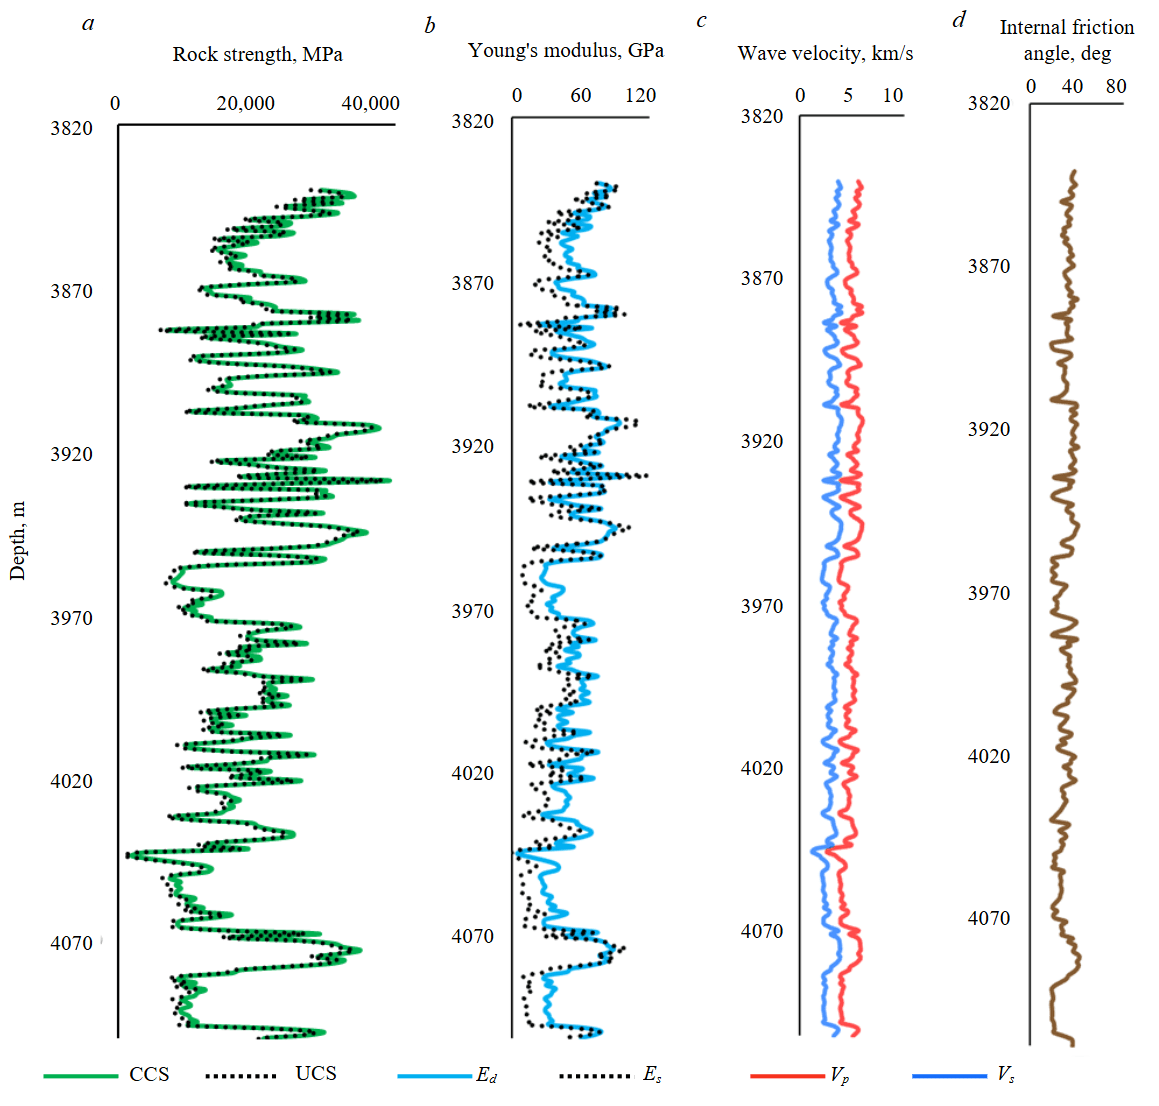
Fig.4. Rock mechanical and strength properties in the studied well
After determining the values for MHMSE and the rock CCS, these values were plotted alongside other drilling parameters in the Asmari formation. This provides the comparison of the specific energy trends with the rock's compressive strength chart to identify problematic zones (Fig.5). At certain depths in the well, drilling parameters have experienced sudden changes, and the impact of these changes on the MHMSE is quite noticeable. In the 4043 to 4068 m depth range, the drilling rate has dropped, accompanied by reductions in rotational speed and torque and an increase in flow rate. Specifically, the drilling rate decreased from 2.7 to 0.3 m/h, rotational speed reduced from 180 to 70 rpm, and torque fell from 2711 to 1627 N·m. Conversely, the flow rate increased from 0.028 to 0.031 m3/s. This zone is identified in grey. In this depth range, the specific energy shows a sudden increase compared to the rock's compressive strength, accompanied by a reduction in ROP. Therefore, the zone was identified as problematic.
For a detailed analysis of the observed results, drilling reports for this depth range have been reviewed, and it was noted that due to the excessive applied energy more than rock strength, the drill bit experienced significant damage, with seven cutters from the polycrystalline diamond compact bit being lost and ten cutters broken. In an efficient drilling operation, all applied surface energy is consumed in the rock destruction process, i.e., increasing the surface energy should result in an increased ROP. If not, it means that the applied energy has been wasted in terms of vibration, oscillation, and drill bit wear.
The relation of controllable drilling parameters with the ROP and MHMSE was investigated for further analysis in the studied well. Figure 6 shows the variation of ROP versus WOB and RPM. Increasing WOB, the axial force on the bit should increase ROP in efficient operations until a threshold WOB value. However, it can be observed from the Fig.6 that increasing the WOB did not significantly enhance the ROP, and at some point, the rate of penetration even decreased. Therefore, increasing the weight on the bit in this well failed to improve drilling efficiency and contributed to greater bit wear. The problematic zone is indicated in grey, where increasing WOB from 26 to 35 kN leads to a decrease in ROP.
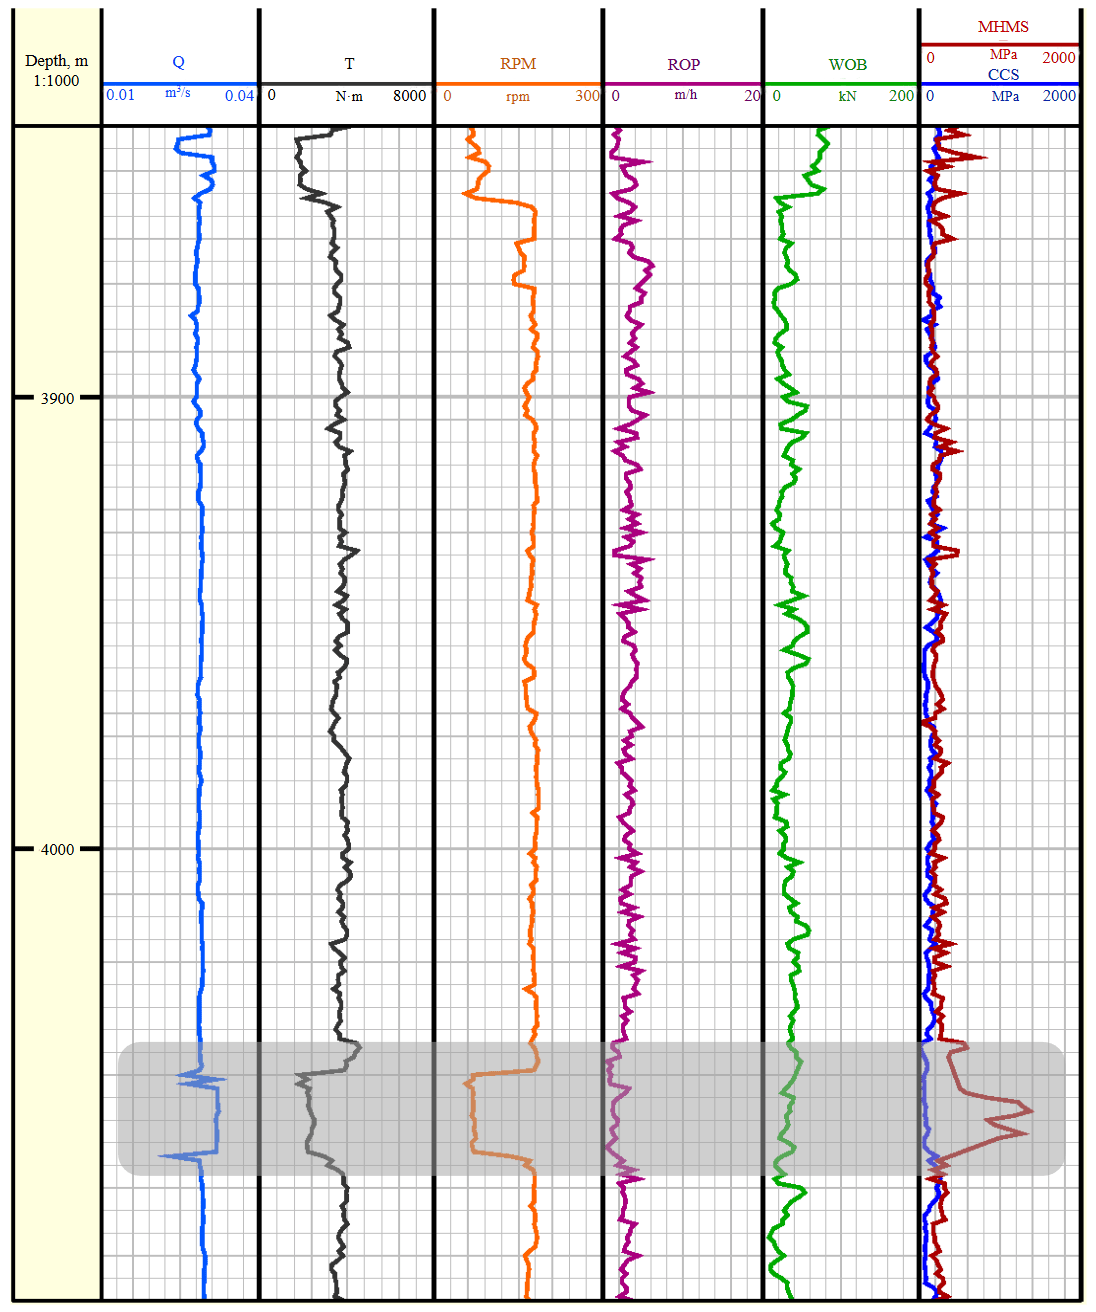
Fig.5. Assessment and evaluation of MSE and CCS of the rock in the well under study
There should be a direct relationship between drill string rotational speed and ROP in optimized operations. However, as can be seen from Fig.6, there is no significant relationship between rotational speed and ROP in the studied well. Increasing the rotational speed may result in substantial applied energy manifesting as vibrations in the drill string. This can cause damage to the bit, increase the torque, and raise the mechanical specific energy, ultimately not providing optimal conditions. To determine the optimal rotational speed, the weight on the bit should be kept constant while varying the rotational speed. By observing changes in the ROP and MSE, the optimal rotational speed can be identified, where an increase in the rotational speed is accompanied by a noticeable increase in the ROP.
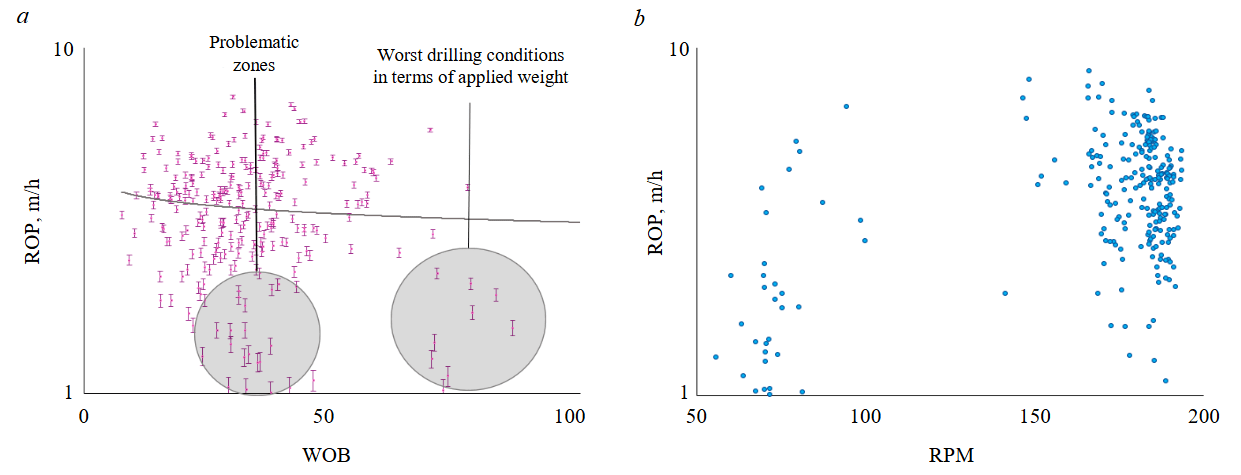
Fig.6. ROP versus WOB (a) and RPM (b)
Another controllable parameter affecting the ROP and MSE is the drilling fluid flow rate into the well. A drilling fluid with a desirable flow rate helps to remove the cuttings beneath the bit, transports them out of the well to the surface, and increases the ROP. In the studied well, the flow rate has remained relatively constant at around 0.028 to 0.029 m3/s.
Figure 7, a shows MHMSE alongside the rock CCS at different ROPs, where efficient and inefficient drilling zones in the studied well were determined. The upper left part of the figure corresponds to an inefficient drilling zone, where applied surface energy is much higher than rock CCS. This means that increased energy did not lead to an increase in ROP. The bottom right end of the figure corresponds to an efficient drilling zone, where MHMSE is closer to rock CCS. This means that increased energy input leads to ROP increase. A transitional zone from inefficient to efficient drilling can be defined in between.
Figure 7, b illustrates the relationship between ROP and WOB. Within the range of 22.24 to 44.48 kN of WOB, the penetration rate approaches approximately 6.1 m/h. At this penetration rate, the MHMSE drops below 344.73 MPa. This result is reasonable, as the MHMSE value is closer to the rock CCS, implying an efficient drilling operation.
Analyzing the relationships between drilling parameters, it can be concluded that the optimal ranges for the weight on bit, drilling fluid flow rate, torque, and rotational speed are 22.24 to 44.48 kN, 0.027 to 0.029 m3/s, 2522 to 3091 N·m, and 160 to 180 rpm, respectively. The optimum values were selected in a way to minimize the MHMSE, while preserving the ROP. Also, in the studied well an inefficient drilling zone was identified, where applying excessive surface energy compared to rock strength led to damage in the drilling bit.
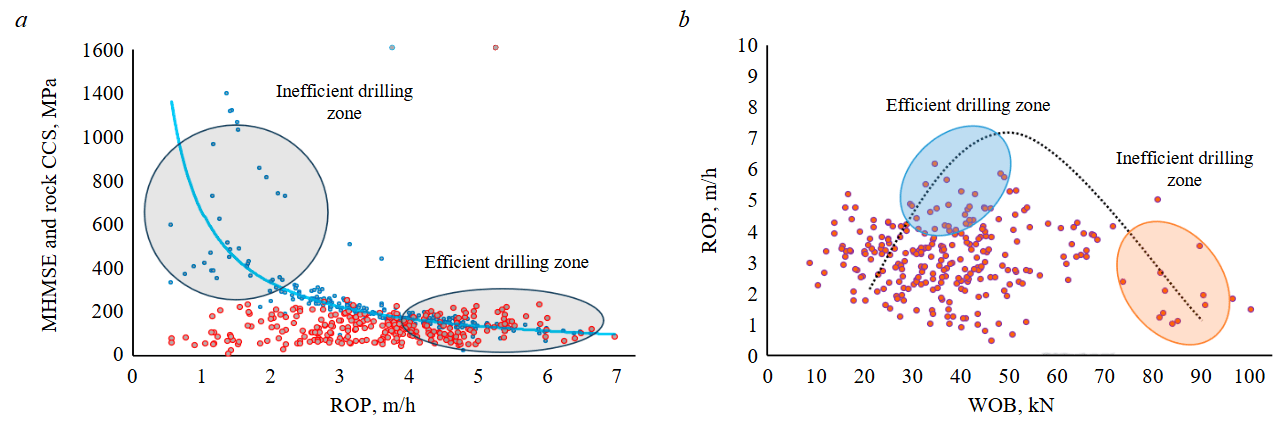
Fig.7. Comparison of MHMSE and CCS versus ROP (a) and ROP versus WOB (b) with identification of effective and ineffective drilling zones
Conclusions
The optimization of the drilling process is of great importance, as it leads to a decrease in the overall cost of the well. There are several approaches for drilling optimization, however, in this work, the concept of mechanical specific energy is utilized for this purpose. Using real field data, some common MSE models were checked and a new MSE model was developed. Comparing the MSE values from the new model with the rock strength could lead to an increase in drilling efficiency. Based on the research conducted, the following main conclusions can be made:
- A modified MSE model for the studied well was developed. Compared to previous models, the modified model gives specific energy values closer to the CCS. The modified model accounts for the effects of parameters such as weight on the bit, rate of penetration, drilling fluid flow rate, and mechanical efficiency factor.
- In the studied well, the optimum value of MHMSE was calculated below 206.84 MPa, as in this depth range, the mechanical specific energy values were close to the formation's rock strength.
- The optimal ranges for the weight on bit, drilling fluid flow rate, torque, and rotational speed were determined as 22.24 to 44.48 kN, 0.027 to 0.029 m3/s, 2522 to 3091 N·m, and 160 to 180 rpm, respectively. Applying optimized values, a reduction in the MHMSE was obtained, where the ROP reaches 4.57 to 6.1 m/h.
- Applying a high WOB, i.e., above 66.72 kN, severely decreases the rate of penetration, reducing it to 1.52 m/h. Meanwhile, the MSE moves out of the optimal range, exceeding 344.73 MPa. This is because applying excessive WOB values results in bit wear, which leads to a ROP reduction.
References
- Weiqiang Song, Huidong Mu, Wenjuan Ji et al. Evaluation and optimization of drilling efficiency while drilling based on improved rock-breaking specific energy model of bit. Geomechanics and Geophysics for Geo-Energy and Geo-Resources. 2024. Vol. 10. Iss. 1. N 174. DOI: 10.1007/s40948-024-00872-9
- Kunshin A., Dvoynikov M., Timashev E., Starikov V. Development of Monitoring and Forecasting Technology Energy Efficiency of Well Drilling Using Mechanical Specific Energy. Energies. 2022. Vol. 15. Iss. 19. N 7408. DOI: 10.3390/en15197408
- Mantegazini D.Z., Nascimento A., Dornelas V.F. et al. Analysis and Multi-Objective Optimization of the Rate of Penetration and Mechanical Specific Energy: A Case Study Applied to a Carbonate Hard Rock Reservoir Based on a Drill Rate Test Using Play-Back Methodology. Applied Sciences. 2024. Vol. 14. Iss. 6. N 2234. DOI: 10.3390/app14062234
- Khalilidermani M., Knez D. A Survey of Application of Mechanical Specific Energy in Petroleum and Space Drilling. Energies. 2022. Vol. 15. Iss. 9. N 3162. DOI: 10.3390/en15093162
- Mohammadi Behboud M., Ramezanzadeh A., Tokhmechi B. et al. Estimation of geomechanical rock characteristics from specific energy data using combination of wavelet transform with ANFIS-PSO algorithm. Journal of Petroleum Exploration and Production Technology. 2023. Vol. 13. Iss. 8, p. 1715-1740. DOI: 10.1007/s13202-023-01644-z
- Oloruntobi O., Butt S. Energy-based formation pressure prediction. Journal of Petroleum Science and Engineering. 2019. Vol. 173, p. 955-964. DOI: 10.1016/j.petrol.2018.10.060
- Oloruntobi O., Butt S. Application of specific energy for lithology identification. Journal of Petroleum Science and Engineering. 2020. Vol. 184. N 106402. DOI: 10.1016/j.petrol.2019.106402
- Leusheva E.L. Evaluation of Possible Application of Powder Made from Fallen Tree Leaves as a Drilling Mud Additive. International Journal of Engineering – Transactions B: Applications. 2024. Vol. 37. Iss. 8, p. 1592-1599. DOI: 10.5829/ije.2024.37.08b.12
- Leusheva E., Brovkina N., Morenov V. Investigation of Non-Linear Rheological Characteristics of Barite-Free Drilling Fluids. Fluids. 2021. Vol. 6. Iss. 9. N 327. DOI: 10.3390/fluids6090327
- Zamanzadeh Talkhouncheh M., Davoodi S., Wood D.A. et al. Robust Machine Learning Predictive Models for Real-Time Determination of Confined Compressive Strength of Rock Using Mudlogging Data. Rock Mechanics and Rock Engineering. 2024. Vol. 57. Iss. 9, p. 6881-6907. DOI: 10.1007/s00603-024-03859-w
- Dupriest F.E., Witt J.W., Remmert S.M. Maximizing ROP With Real-Time Analysis of Digital Data and MSE. International Petroleum Technology Conference, 21-23 November 2005, Doha, Qatar. OnePetro, 2005. N IPTC-10607-MS. DOI: 10.2523/IPTC-10607-MS
- Armenta M. Identifying Inefficient Drilling Conditions Using Drilling-Specific Energy. SPE Annual Technical Conference and Exhibition, 21-24 September 2008, Denver, CO, USA. OnePetro, 2008. N SPE-116667-MS. DOI: 10.2118/116667-MS
- Rafatian N., Miska S., Ledgerwood L.W. et al. Experimental Study of MSE of a Single PDC Cutter Interacting With Rock Under Simulated Pressurized Conditions. SPE Drilling & Completion. 2010. Vol. 25. Iss. 1, p. 10-18. DOI: 10.2118/119302-PA
- Thomson I.J., Mathur R. The Use of Downhole Drilling Parameters Combined With Surface and Downhole Mechanical Specific Energy Data Helped Identify Under-Reamer Dysfunctions in GoM Deepwater Projects. SPE Deepwater Drilling and Completions Conference, 5-6 October 2010, Galveston, TX, USA. OnePetro, 2010. N SPE-137139-MS. DOI: 10.2118/137139-MS
- Hammoutene C., Bits S. FEA Modelled MSE/UCS Values Optimise PDC Design for Entire Hole Section. North Africa Technical Conference and Exhibition, 20-22 February 2012, Cairo, Egypt. OnePetro, 2012. DOI: 10.2118/149372-MS
- Chao Xiong, Zhong-Wei Huang, Huai-Zhong Shi et al. Performances of a Stinger PDC cutter breaking granite: Cutting force and mechanical specific energy in single cutter tests. Petroleum Science. 2023. Vol. 20. Iss. 2, p. 1087-1103. DOI: 10.1016/j.petsci.2022.10.006
- Xuyue Chen, Xu Du, Chengkai Weng et al. A real-time drilling parameters optimization method for offshore large-scale cluster extended reach drilling based on intelligent optimization algorithm and machine learning. Ocean Engineering. 2024. Vol. 291. N 116375. DOI: 10.1016/j.oceaneng.2023.116375
- Mohan K., Adil F., Samuel R. Comprehensive Hydromechanical Specific Energy Calculation for Drilling Efficiency. Journal of Energy Resources Technology. 2015. Vol. 137. Iss. 1. N 012904. DOI: 10.1115/1.4028272
- Mohammadi Behboud M., Ramezanzadeh A., Tokhmechi B. Studying empirical correlation between drilling specific energy and geo-mechanical parameters in an oil field in SW Iran. Journal of Mining and Environment. 2017. Vol. 8. Iss. 3, p. 393-401. DOI: 10.22044/jme.2016.689
- Dvoynikov M., Kunshin A., Blinov P., Morozov V. Development of Mathematical Model for Controlling Drilling Parameters with Screw Downhole Motor. International Journal of Engineering – Transactions B: Applications. 2020. Vol. 33. Iss. 7, p. 1423-1430. DOI: 10.5829/ije.2020.33.07a.30
- Litvinenko V.S., Dvoynikov M.V. Methodology for determining the parameters of drilling mode for directional straight sections of well using screw downhole motors. Journal of Mining Institute. 2020. Vol. 241, p. 105-112. DOI: 10.31897/PMI.2020.1.105
- Jinbo Song, Jianlong Wang, Bingqing Li et al. Real-Time Drilling Parameter Optimization Model Based on the Constrained Bayesian Method. Energies. 2022. Vol. 15. Iss. 21. N 8030. DOI: 10.3390/en15218030
- Khoshouei M., Bagherpour R. Measurement, prediction, and modeling of the drilling specific energy by soft rock properties during the drilling operation. Measurement. 2023. Vol. 222. N 113679. DOI: 10.1016/j.measurement.2023.113679
- Yavari H., Fazaelizadeh M., Aadnoy B.S. et al. An approach for optimization of controllable drilling parameters for motorized bottom hole assembly in a specific formation. Results in Engineering. 2023. Vol. 20. N 101548. DOI: 10.1016/j.rineng.2023.101548
- Menand S., Mills K. Use of Mechanical Specific Energy Calculation in Real-Time to Better Detect Vibrations and Bit Wear While Drilling. AADE National Technical Conference and Exhibition, 11-12 April 2017, Houston, TX, USA. American Association of Drilling Engineers, 2017. N AADE-17-NTCE-033.
- Ramba V., Selvaraju S., Subbiah S. et al. Optimization of drilling parameters using improved play-back methodology. Journal of Petroleum Science and Engineering. 2021. Vol. 206. N 108991. DOI: 10.1016/j.petrol.2021.108991
- Dupriest F., Lai S., Behounek M. et al. Standardization of Mechanical Specific Energy Equations and Nomenclature. SPE Drilling & Completion. 2023. Vol. 38. Iss. 1, p. 73-89. DOI: 10.2118/208777-PA
- Xuyue Chen, Deli Gao, Boyun Guo, Yongcun Feng. Real-time optimization of drilling parameters based on mechanical specific energy for rotating drilling with positive displacement motor in the hard formation. Journal of Natural Gas Science and Engineering. 2016. Vol. 35. Part A, p. 686-694. DOI: 10.1016/j.jngse.2016.09.019
- Song Deng, Shuo Yang, Yudie Chi et al. Bit optimization method for rotary impact drilling based on specific energy model. Journal of Petroleum Science and Engineering. 2022. Vol. 218. N 110977. DOI: 10.1016/j.petrol.2022.110977
- Kuilin Huang, Yingxin Yang, Gao Li et al. Torsion and vibration reduction mechanism of roller PDC hybrid bit. Journal of Petroleum Science and Engineering. 2022. Vol. 208. Part B. N 109491. DOI: 10.1016/j.petrol.2021.109491
- Verma A.K., Deb D., Dey A.C. et al. Development of one dimensional geomechanical model for a tight gas reservoir. Scientific Reports. 2021. Vol. 11. N 21433. DOI: 10.1038/s41598-021-00860-z
- Ye Liu, Shuming Liu, Jiafeng Zhang, Jie Cao. Real-time estimation of geomechanical characteristics using drilling parameter data and LWD. Geoenergy Science and Engineering. 2025. Vol. 244. N 213450. DOI: 10.1016/j.geoen.2024.213450
- Shijie Shen, Yanfang Gao, Lichun Jia. A Comparison of the Relationship between Dynamic and Static Rock Mechanical Parameters. Applied Sciences. 2024. Vol. 14. Iss. 11. N 4487. DOI: 10.3390/app14114487
- Abdul Aziz Q.A., Awadh S.M., Al-Mimar H.S. Estimation of Rock Mechanical Properties of the Hartha Formation and their Relationship to Porosity Using Well-Log Data. Iraqi Geological Journal. 2024. Vol. 57. N 1A, p. 34-44. DOI: 10.46717/igj.57.1A.4ms-2024-1-15
- Daraei A., Sharifi F., Qader D.N. et al. Prediction of the static elastic modulus of limestone using downhole seismic test in Asmari formation. Acta Geophysica. 2024. Vol. 72. Iss. 1, p. 247-255. DOI: 10.1007/s11600-023-01109-1
- Davarpanah S.M., Ván P., Vásárhelyi B. Investigation of the relationship between dynamic and static deformation moduli of rocks. Geomechanics and Geophysics for Geo-Energy and Geo-Resources. 2020. Vol. 6. Iss. 1. N 29. DOI: 10.1007/s40948-020-00155-z
- Almalikee H.S. Predicting Rock Mechanical Properties from Wireline Logs in Rumaila Oilfield, Southern Iraq. American Journal of Geophysics, Geochemistry and Geosystems. 2019. Vol. 5. N 2, p. 69-77.
- Zixu Wang, Junhong Huang, Yanglong Chen et al. Dynamic mechanical properties of different types of rocks under impact loading. Scientific Reports. 2023. Vol. 13. N 19147. DOI: 10.1038/s41598-023-46444-x
- Shahani N.M., Ullah B., Shah K.S. et al. Predicting Angle of Internal Friction and Cohesion of Rocks Based on Machine Learning Algorithms. Mathematics. 2022. Vol. 10. Iss. 20. N 3875. DOI: 10.3390/math10203875
- Rakhi, Gupta B., Lamba S.S. An efficient local outlier detection approach using kernel density estimation. Franklin Open. 2024. Vol. 8. N 100162. DOI: 10.1016/j.fraope.2024.100162
- Cangussu N., Milheiro-Oliveira P., Matos A.M. et al. Comparison of outlier detection approaches for compressive strength of cement-based mortars. Journal of Building Engineering. 2024. Vol. 95. N 110276. DOI: 10.1016/j.jobe.2024.110276