Localization of sites for the development of geomechanical processes in underground workings based on the results of the transformation and classification analysis of seismic data
- 1 — Ph.D. Associate Professor Empress Catherine II Saint Petersburg Mining University ▪ Orcid ▪ Scopus ▪ ResearcherID
- 2 — Postgraduate Student Empress Catherine II Saint Petersburg Mining University ▪ Orcid ▪ Scopus
- 3 — Ph.D. Associate Professor Empress Catherine II Saint Petersburg Mining University ▪ Orcid
Abstract
The paper considers an approach to localizing the intervals of development of geomechanical processes in underground structures based on the classification and transformation of seismic data. The proposed approach will make it possible to identify the intervals of fracturing, rock decompression, water inflow and other geomechanical processes when interpreting the results of seismic surveys. The technique provides for the formation of matrices of longitudinal (Vp), transverse (Vs) velocities and velocity ratios (Vs/Vp) along the research profile to perform sequential filtration. The filtration results serve as the basis for the formation of a bank of informative materials for further classification. Based on the domestic KOSKAD 3D software, four approaches have been implemented for a combined digital model of the Vp, Vs and Vs/Vp parameters. One of the key elements in the classification process is to combine grids to increase the probability of detecting intervals with heterogeneous identification features. The result of the application of this methodical approach is the construction of a comprehensive interpretative model, on which potential zones of geomechanical risks development are clearly manifested.
None
Introduction
The current state of urbanized territories cannot be imagined without the intensive development of the mineral resource sector aimed at the development and processing of minerals. This trend implies an increase in production capacities, exploration and development of new deposits, construction of new mining and technical facilities, as well as an increase in operational loads on existing facilities. More intensive mining operations, the tunneling of new workings, the formation of rock dumps and additional loading of existing ones can contribute to the development of geomechanical risks due to deformation, stress redistribution and destruction of rock masses. Often, the geomechanical processes occurring in the rock mass are hidden and are not visually manifested. The influence of tectonic and operational factors on stress changes in the rock mass is a very relevant topic of research in recent decades [1]. Therefore, in order to ensure the safety of mining operations, it is necessary to timely identify the intervals of formation of the zones of geomechanical processes intensification that potentially affect the operational reliability of mining facilities due to stress redistribution in the rock mass. Hidden zones of development of geomechanical phenomena associated with the activation of tectonic processes manifest themselves in the form of the development of zones of decompression, fracturing and leaching. The development of these processes leads to the formation of water supply channels in the rock mass, which increase water flow into underground workings and act as a catalyst for the further development of denudation processes at a more intense rate, and, as a result, the appearance of visible deformations and increased risks during mining operations.
For forecasting, a standard set of geotechnical monitoring works is performed at the mines, including surveying observations on reference points, monitoring of seismic phenomena within the seismic ranges of the seismic pavilion of mine, and hydrogeological monitoring. However, before the appearance of visual and noticeable deformations in the rock mass, which are well localized according to the results of surveying and hydrogeological work, hidden deformation intervals may form in the body of the rock mass, bearing potential geomechanical risks, timely identification of which is possible based on the involvement of modern geophysical technologies and algorithms [2, 3].
To solve the problem of forecasting geomechanical risk zones, the paper proposes conducting underground high-resolution seismic exploration on longitudinal and transverse waves. Processing and interpretation of research results implies the use of algorithms for transformation and classification of velocity sections.
At the processing stage, as a promising set of tools, it is possible to identify transformations of the source data through filtering by various methods and classification of the combined block of source matrices with the filling of missing or unsuitable data for subsequent analysis [3]. This approach has been well studied within the framework of the tasks of interpreting potential fields, but it is specific for the seismic data transformation. It is proposed to use alternative filtering methods that have successfully proven themselves in processing geopotential field data [4]. This direction can add new useful sources of information, will allow to localize the decompressed and weakened zones that form the area of geomechanical risks development in the rock mass, based on data from specialized seismic surveys.
Methods
Timely detection of disturbed intervals in the field of interaction of underground workings with the host rock mass and into the depth of the rock mass, control of the stress-strain state (SSS) of the rock mass are possible on the basis of the development of underground geophysics technologies. Underground geophysical surveys at mines have been successfully used for more than half a century. The experience of their approbation, taking into account modern hardware and technological progress, allows to determine the most optimal methods of geophysics for assessing and predicting the SSS of rock mass, which allow conducting studies of the state of mining and technical structures on the principles of minimizing invasive impact in order to reduce the risks of developing new geomechanical processes [5-7].
As part of the research work at the mines of the Talkhanskoe and Oktyabrskoe fields (Norilsk), complex geophysical studies of underground mining were carried out. The complex consisted of methods of georadiolocation, seismic studies and registration of natural electromagnetic emissions (NEME). The data of the NEME method for the tasks of transformational-classification constructions cannot be represented in the form of a two-dimensional model, therefore transformations and classifications in the framework of this study are not applied to these data. The georadiolocation method is also not subject to transformation and classification due to the limited depth of research (up to 8 m).
In the context of the considered geotechnical tasks, it is possible to formulate general requirements for the geophysical methods proposed for research:
- the main vector of research is mainly focused on the investigation of the structure and the forecast of stability (disturbance) of the rock-bearing mass of the workings roof [6];
- examination of the workings roof of located in complex SSS by geophysical methods should be carried out with minimal invasive impact, without additional deformation risk;
- in most cases, the monitoring of the workings roof is complicated by the presence of a dense network of communications (water pipes, concrete pipelines, cables, etc.), therefore, geophysics methods should be able to obtain useful information in these conditions [8];
- the applied methods of geophysics should have the potential for long-term prediction of SSS and physical and mechanical properties of the rock mass [9, 10].
Taking into account the requirements for geophysical technologies and the possibilities of presenting data in the form of data matrices in a two-dimensional domain, the seismic refraction wave method (SRM) with subsequent tomographic data processing (PKMPV-CT) is the most optimal, despite the labor costs associated with the specifics of the work [11-13].
When working out seismic profiles in mine conditions on the workings roof, the following registration parameters were used: the pitch of the receiving points (RP) is 2 m; the pitch of the vibration points (VP) is 2 m; the number of RP on the profile is 76; elastic vibrations were aroused by a hammer weighing 6 kg. This type of installation was selected on the basis of experimental and methodical work and the size of the studied areas, corresponding to the size of the bin. The seismic research method involves working with the removal of vibration points beyond the main alignment by 10 m, which contributes to obtaining seismic records to a depth of up to 50 m. Field seismic work was carried out using a modern telemetric seismic survey station “TELSS-3” manufactured by OOO “Geosignal” (Moscow). The station has an advantage, according to its technical characteristics, over analogues for the implementation of underground observations, consisting in the possibility of forming an individual noise-proof line of alignment due to a segmented seismic spit connected by telemetry modules [14].
The processing of seismic data is divided into several stages: the first is the evaluation of field data, the performance of primary filtering and amplification of the initial signal, the second is the assignment of the geometry of the alignment in the local coordinate system (X, Y, Z), the third is the picking of the hodographs of deflected and refracted longitudinal and transverse waves, followed by the calculation of tomographic sections (Vp, Vs). The tomographic inversion of hodographs consists in solving the inverse problem of tomography using the Fourier transform and the least squares method, which involves minimizing the discrepancy when ray tracing obeys the basic laws of geometric seismics with a minimum time of passage of an elastic wave through a system of elementary cells [15].
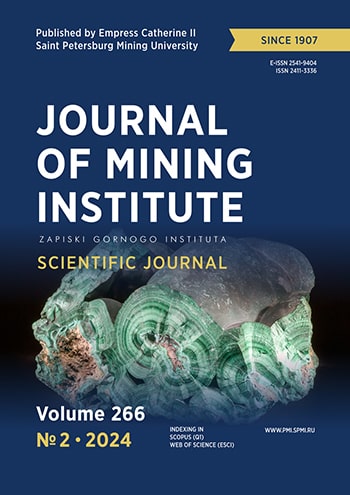
Further processing of seismic data consists in calculating the ratio of the velocities of transverse and longitudinal waves and preparing the initial matrices (Vp, Vs, Vs/Vp) of the data (Fig.1) for the procedure of transformation and classification analysis of seismic data.
The first stage of the transformation of the processed data is the assessment of the input materials for the quality, unity and soundness of the values for the research object under consideration. Then the transformants are calculated, including such filters as averaging in a sliding window (Moving Average) with selected sizes of the semi-axes of the averaging ellipse of 5×7 and 15×25 m, in which the most informative results are obtained by the minimum size of the axes, taken as optimal; low-frequency convolution filtering (Low-Pass Gaussian) with a standard window size 3×3, Mean Absolute Deviation (MAD); Standard Deviation, which allows to estimate the spread of values relative to the standard for the measured parameter Vs or Vp (the standard deviation is the square root of the variance); calculation of the horizontal gradient, which allows to identify destruction zones by changing the nature of the field from a positive to a negative value, etc. [16]. The main task of filtering is to suppress interference and extract useful information for the correct interpretation of the results obtained [17]. A more detailed description of the filters used is given in the Table.
After the formation of a working bank, including maps of calculated transformants, the quality of the obtained materials is assessed [18, 19]. The most informative transformants are selected for involvement in the processes of complex interpretation and classification of transformed materials [20-22].
At the second stage, classification is performed using the KOSKAD 3D software [23-26]. To begin with, the initial matrices for the values of the velocities of longitudinal and transverse waves and their ratios are loaded. The next procedure is to fill in missing or incorrect values that could have been mistakenly recorded and not eliminated at the stage of primary data processing. After filling in the missing values, the three “grids” are combined to apply the classification operation.
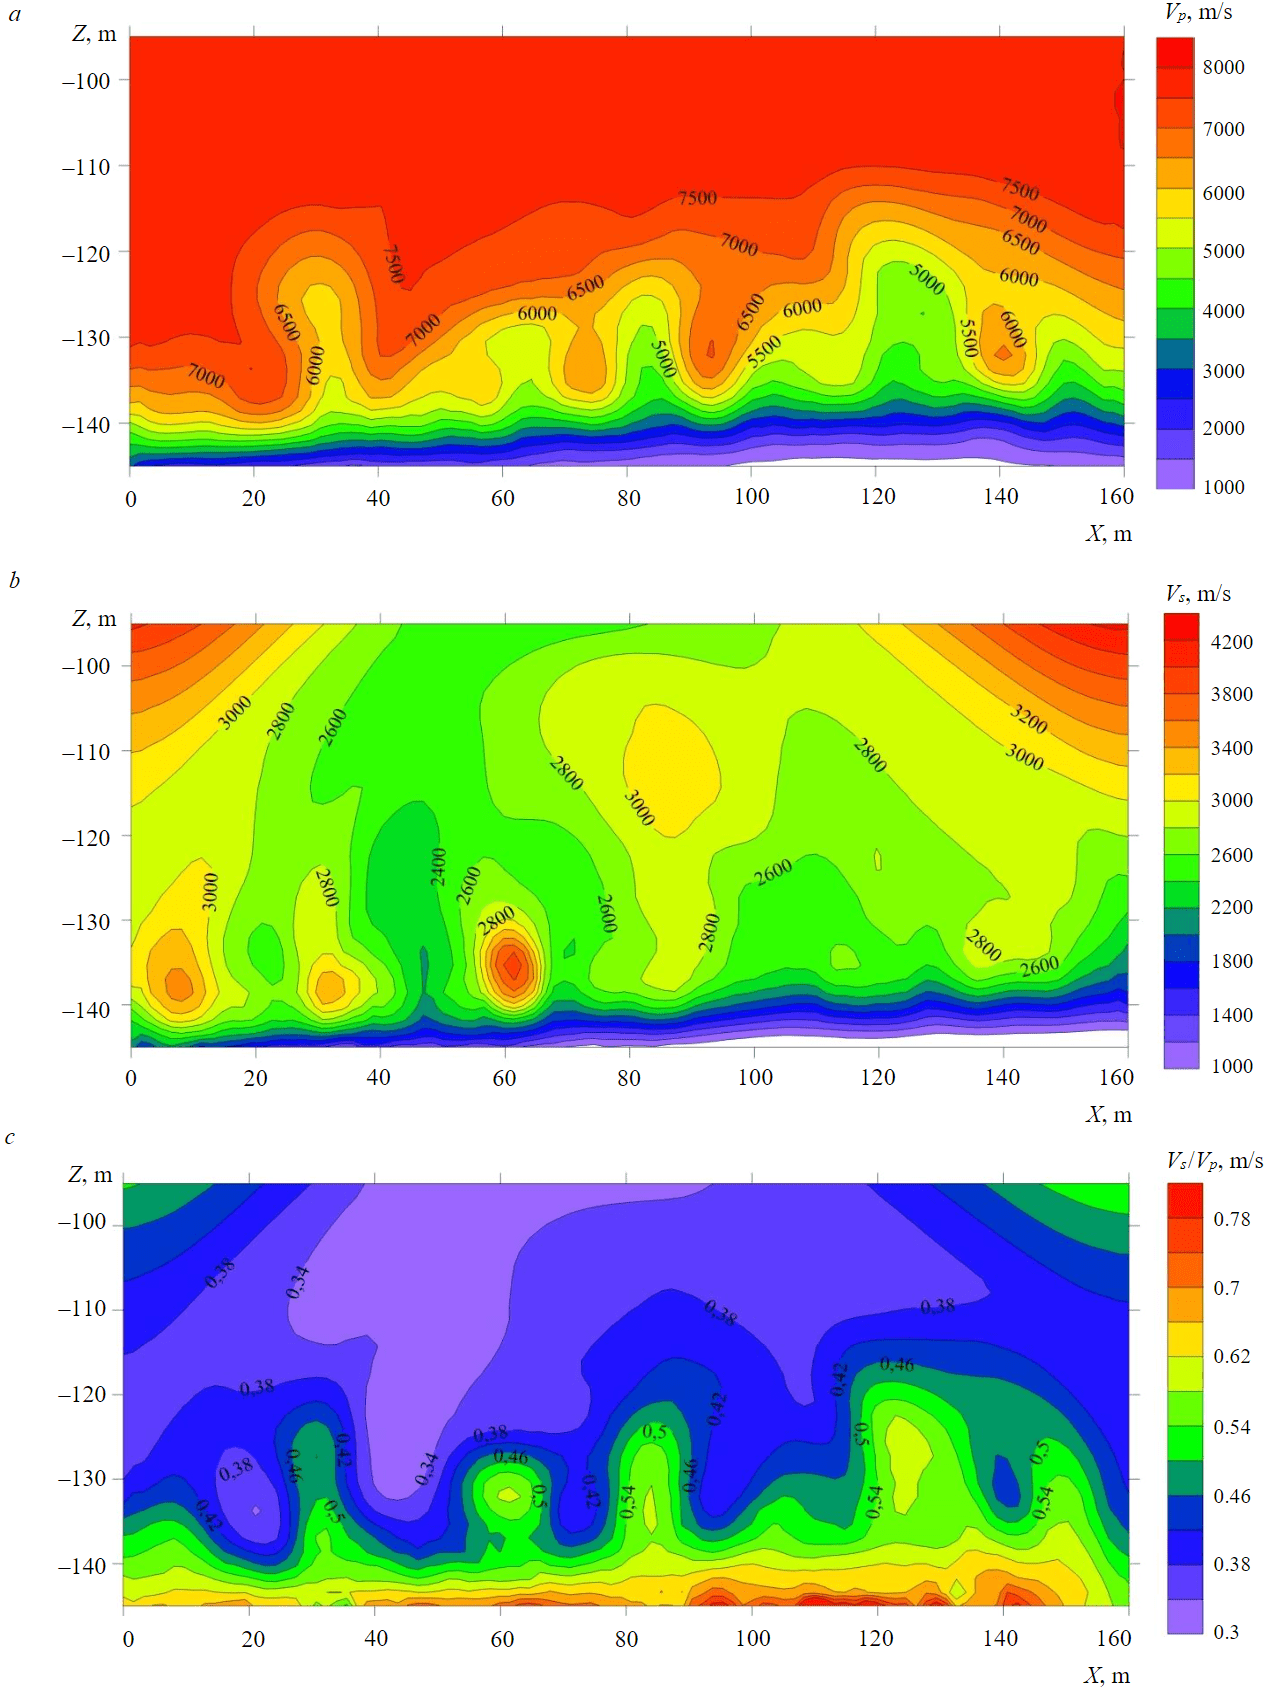
Fig.1. Initial tomographic sections of longitudinal (a), transverse (b) velocities and velocity ratios (c)
Characteristics of the applied filtrations
|
Title |
Description |
Formula |
|
Averaging in a sliding window |
The method of constructing a moving average grid allows to assign values to grid nodes by averaging data within the ellipse of the grid node search.Due to the specifics of this method, its use for small and medium-scale maps is not recommended, however, this tool is useful when working with a large bank of spatial data, since it allows you to identify regional anomalies, the amplitude of which depends on the size of the specified averaging window [13]. The minimum amount of data sets the value of the points when interpolating a grid node. For each grid node, neighboring data is identified by centering the search ellipse on the node. The value of the output node of the grid is set equal to the arithmetic mean of the identified neighboring data [16]. |
Arithmetic mean averaging is performed using a radial-annular or square pallet, or within a certain interval according to the formula where is the average value of the field within the averaging area; Zi is the value of the field in the i-th node of the pallet; N is the total number of nodes. |
|
Low-frequency convolution operation |
The low-pass filter removes high-frequency noise, resulting in a smoother grid at the output. When working with one of the four low-frequency filters, it must be taken into account that the width and height of the filter neighborhood must be positive odd numbers [15]. With a Gaussian low pass filter, the weight decreases with increasing distance. This weight function has the shape of half of the total bell curve. The parameter α determines how fast the weight decreases with distance. The lower the value of α, the more weight the neighborhood points have in the grid value and the slower the weight decreases. The higher the value of α, the greater the weight of the central point in the grid value and the faster the weight of other points decreases [17]. |
With the height of the neighborhood S and the width T the distance weighting function is where α is a positive value. |
|
The average absolute deviation |
Determining the nature of the distribution of the difference between the absolute and average values of the points [18, 19] allows to estimate the amount of variation that occurs around the average value in the dataset. The effect of this filter is to highlight outliers in the grid [18]. The disadvantage of this method is the limited mathematical manipulation compared to variance. |
The average absolute deviation where — the average value of the sample; n is the number of observations in the sample. |
|
Standard deviation |
Moment statistics filters – standard deviation (mxn). The value of the output node of the grid is equal to the standard deviation of neighboring values [22]. |
The standard deviation is the square root of the variance where хi is the value of a single sample value; μ is the arithmetic mean of the sample; n is the sample size. |
The classification procedure is a component of the functional block “Complex” [25], designed for processing multi-sign geological and geophysical information [27, 28]. With the help of classification, the area under consideration is divided into regions that are homogeneous in several ways [29, 30]. The algorithms used are based on self-learning, taking into account the correlations of the entire feature space, with the possible absence of a priori knowledge about the position of the initial centers and a finite number of classes with homogeneous features.
An interesting characteristic of this method is the processed field of features [31, 32], in which the transformed matrices [33] obtained at the previous stage can be set as source materials. As a result of applying the algorithm, a network is formed containing information about the class identification of each point. The involvement of transformed materials as secondary input data allows additional selection of the most significant results.
Taking into account the fact that at the stage of calculating transformants, interference is suppressed and eliminated and data quality is improved, and the use of improved digital matrices allows to get a more reliable picture at the output. This approach makes it possible to include additional components for the formation of a class distribution in a multi-sign space [34, 35].
Classification is implemented by four main methods:
- The total distance method, in which a finite number of classes are selected automatically.
- The method of dynamic thickening (K-means), in which information about a finite number of classes is set by the user, and the transformation is performed through an iterative empirical procedure.
- A method for separating multidimensional normal mixtures, implying the variability of specifying a finite number of homogeneous regions using multidimensional analysis of variance.
- A symbolic classification that divides the study area into positive and negative signs.
The final stage is the interpretation of the results obtained. For this purpose, a working data bank is formed, containing maps based on source data, transformations and classifications in a single binding [36, 37]. After that, a comprehensive analysis of a priori and transformed information is performed, according to the results of which zones of localization of abnormal values at the boundaries of the change in the nature of physical properties are identified [38-40], which are compared with the physical and mechanical parameters of the medium under study. At this stage, anomalies caused by edge effects are eliminated and a generalized interpretative model is created.
Results
As a result of the performance of seismic surveys of the PKMPV at the mines of the Talnakhskoe and Oktyabrskoe fields (Norilsk), seismograms of a common vibration point were obtained in several profiles. The uniqueness of the seismic research methodology lies in the vibration and registration of elastic waves in the roof of mine workings. The resulting seismograms are subjected to the procedures of primary filtration and assignment of the arrangement geometry. The following hodographs of elastic waves are read on seismograms: diffracted, refracted longitudinal, refracted transverse and reflected. Further tomographic processing of the data consists in the conversion of the read hodographs of elastic refracted and refracted waves in velocity using the Fourier transform. Qualitative interpretation provides for the identification and tracing in the context of anomalous areas or zones related to various geomechanical processes.
The main criteria for the occurrence of the process of rocks decompression is a decrease in the propagation velocities of longitudinal and transverse elastic waves. On seismotomographic sections of longitudinal and transverse waves of the region of increased velocities, areas where a stress state occurs due to tectonophysical effects that resonate in rocks are identified.
Another unfavorable geomechanical process in mining is the increased water inflow into the mine, which occurs due to water seepage from overlying water-bearing stratum in the field of geomechanical destruction processes. The characteristic of the areas of potential water occurrences into the mine at seismic sections is revealed as follows: a gradual decrease in the propagation velocities of longitudinal waves, a decrease in the propagation velocities of transverse waves, an increase in the velocity ratio. The obtained sections show anomalous regions characterized by reduced velocities of longitudinal and transverse waves, as well as reduced velocity ratios in the area of pickets 30-40, 60-70, 80-92, 120-135 m (Fig.1), which indicates the presence of rock decompression areas in localized areas. Further quantitative interpretation implies the calculation of transformants and the classification of the obtained high-speed tomographic sections [37].
The transformed sections obtained as a result of applying the procedures indicated in the table are subjected to a qualitative assessment for information content, namely, the preservation of abnormal areas on the sections, minimal distortion of the original data array. These requirements are met by seismic tomographic sections transformed by averaging in a sliding window (Fig.2). On the sections, it is possible to clearly trace areas with average and increased velocity values, which corresponds to zones of tension on the source materials, areas of reduced velocity values, and decompressed rocks. The most reliable picture of the geophysical properties occurred in the case of considering the section of the ratio of the velocities of transverse waves to longitudinal ones [41]. The need to select the most informative filtering results arises from the transition to the next stage of classification [39].
Discussion of results
Examples of visualization of classification results by combined Vs, Vp and Vs/Vp matrices are shown in Fig.3: a – the method of total distance, b – the method of dynamic thickening (K-means), c – by the separation method of multidimensional normal networks (according to A.V.Petrov), d – by the method of sign classification. Obviously, the most informative results are the classifications performed by the method of separation of multidimensional normal networks (Fig.3, c) and dynamic thickenings (K-means) (Fig.3, b) due to the better localization of anomalous regions and their connection with the initial data [41]. However, when filling in the missing values, edge effects have a strong influence on the final representation of the sections, which can be mistaken for abnormal indicators during interpretation. That is why it is important to analyze a priori and transformed materials to exclude incorrect conclusions [42, 43].
The method of dynamic thickening (K-means) is an effective way to classify multidimensional values in conditions of a minimum of a priori information about class centers through the use of K-means (where K is the number of classes) [35]. For all processed features, the value of the standard deviation is estimated, which is also given when filtering by the standard deviation method using normalization and the creation of new vector class centers. The main advantage of this method is fast convergence; the disadvantage is incomplete consideration of correlations of the feature space [23, 44]. It is the classification by the method of dynamic thickening that is chosen as the basis of the interpretative model as the most informative, since when compared with a priori sections (see Fig.1), abnormal areas are very reliably revealed in Fig.3, b.
In total, eight classes are allocated on the interpretative model: the 1st class corresponds to the appearance of boundary effects and localization of maximum velocity values; the 2nd class characterizes the appearance of zones of mechanical disturbances or increased stresses; the 3rd-6th classes emphasize the contours of the distribution of the main blocks characterized by the same type of signs, divided into subgroups for more convenient identification during subsequent interpretation; the 7th class accumulates signs with reduced velocity values; the 8th class accumulates signs with the most cartelized indicators. For direct interpretation, classes 2 and 8 are of the greatest interest, since it is based on them that it is possible to most reliably determine the zones of localization of stress states.
The resulting interpretative model (Fig.4) demonstrates the position of anomalous sections along the studied profile, which correspond to zones of potential excess of the normal deformation state of the studied rock mass. It is these zones that pose the greatest danger when planning underground work and require additional measures to ensure a safe working process while minimizing economic and technological risks. The comparison of the obtained localized zones with the materials of primary study, namely, with the visualized matrices of longitudinal and transverse waves along the studied profile, confirms the correctness of the application of the methodology for classifying seismic data by analogy with geopotential fields [38, 45]. The involvement of the petrophysical characteristics of the studied rock mass makes it possible to identify patterns of mapping elastic properties represented by longitudinal and transverse waves in two-dimensional space [46, 47].
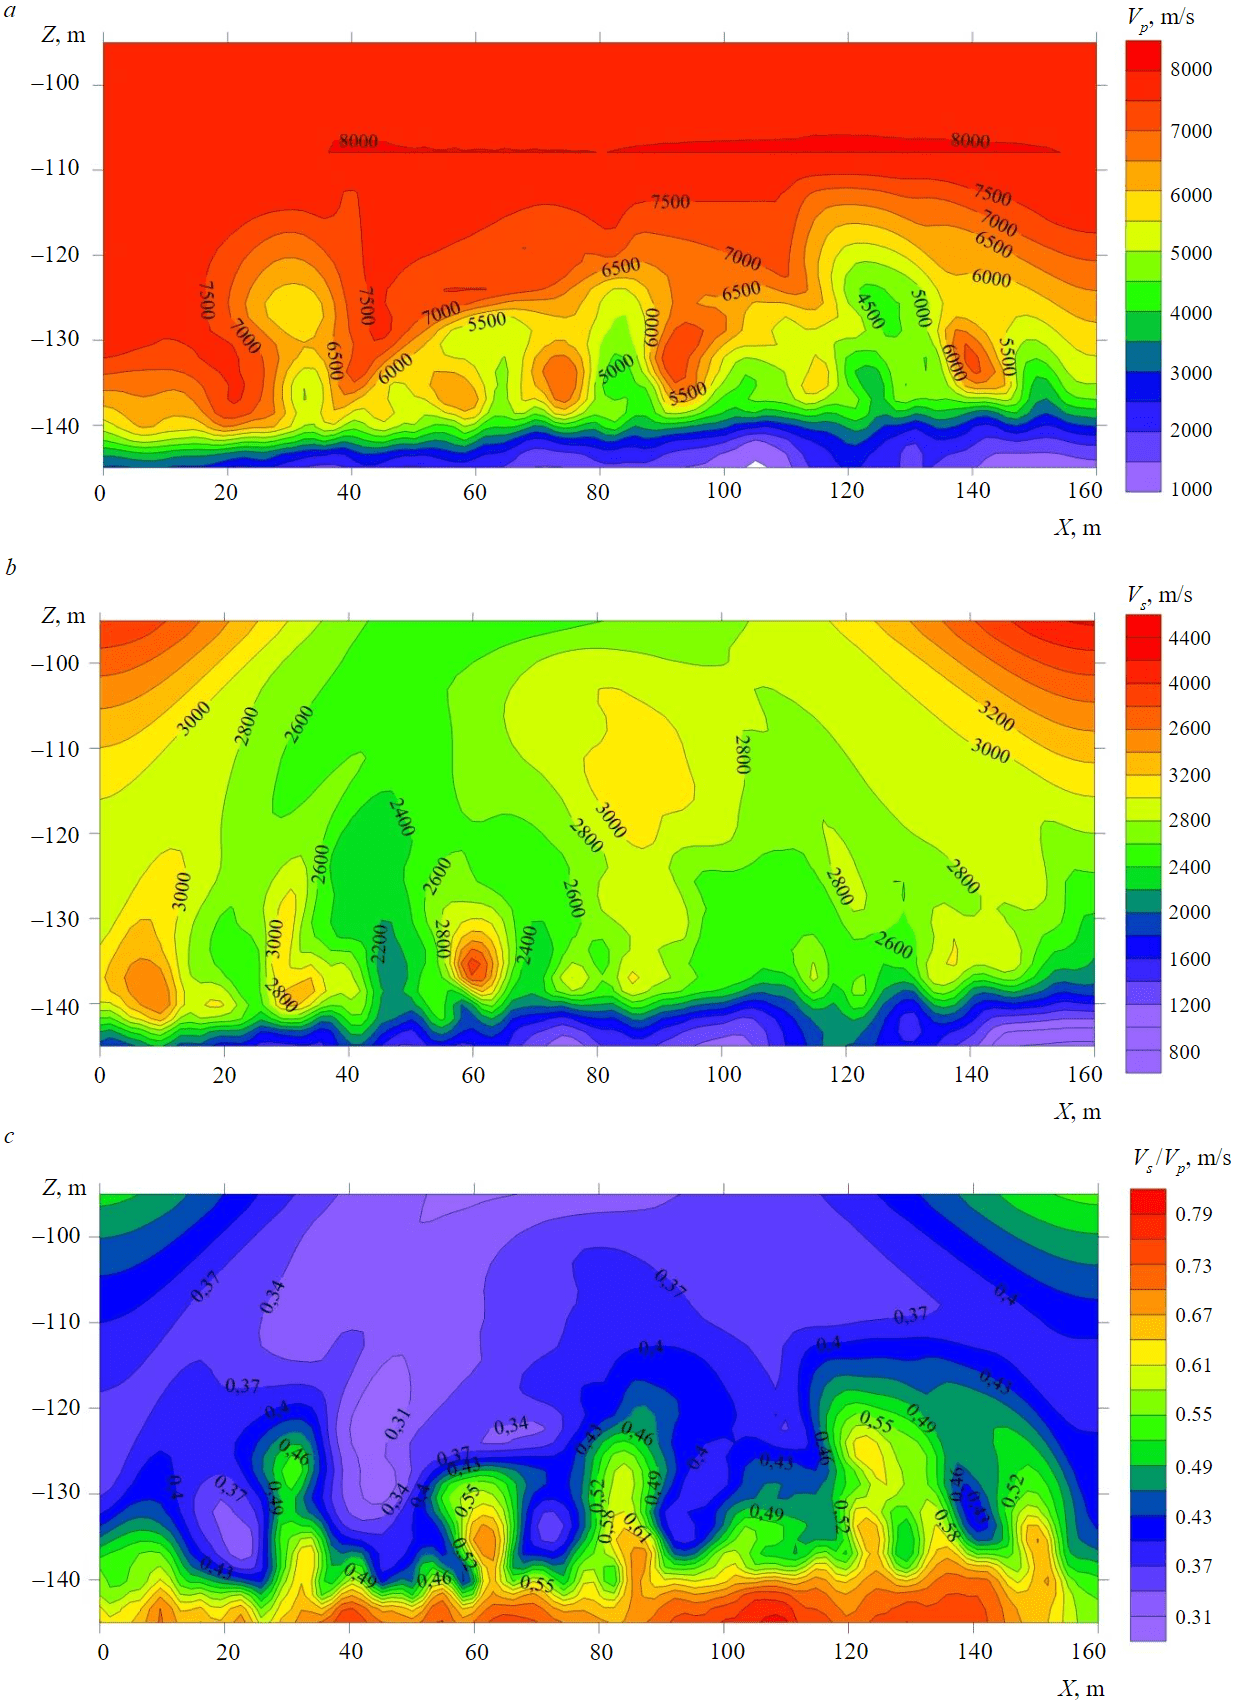
Fig.2. An example of visualization of calculated transformants by averaging in a sliding window obtained for matrices of longitudinal (a), transverse (b) velocities and velocity ratios (c)
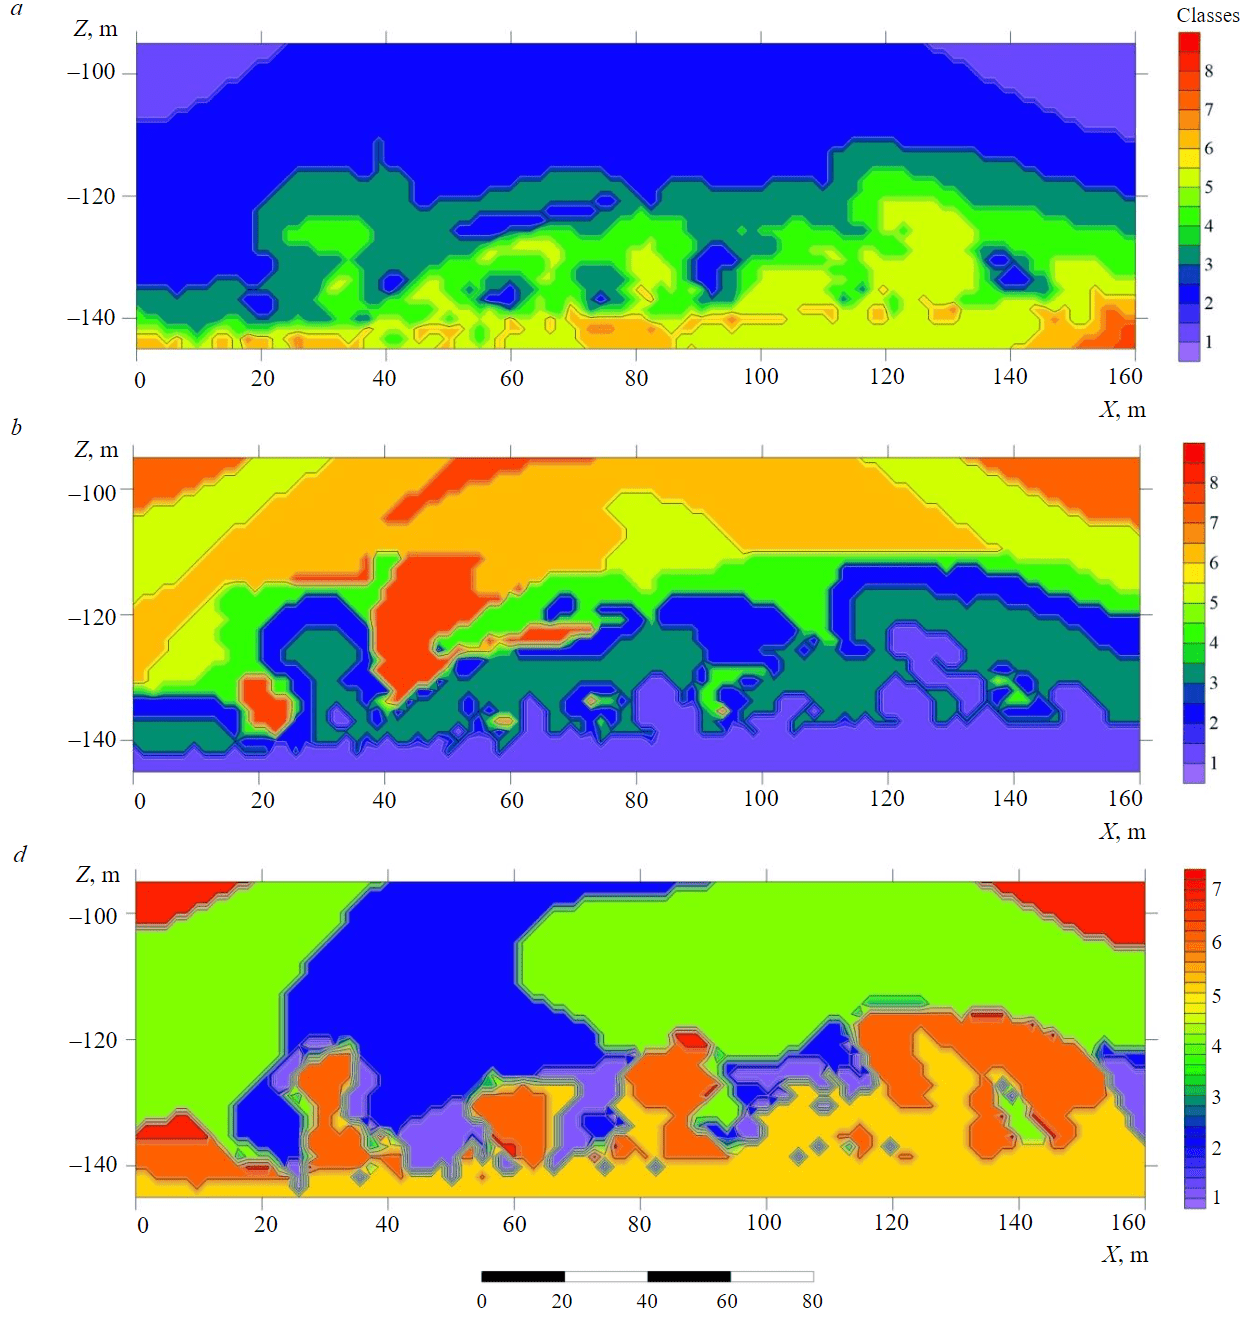
Fig.3. Classification results: a – the method of total distance; b – the method of dynamic thickening (K-means); c – the method of separation of multidimensional normal networks; d – the method of sign classification
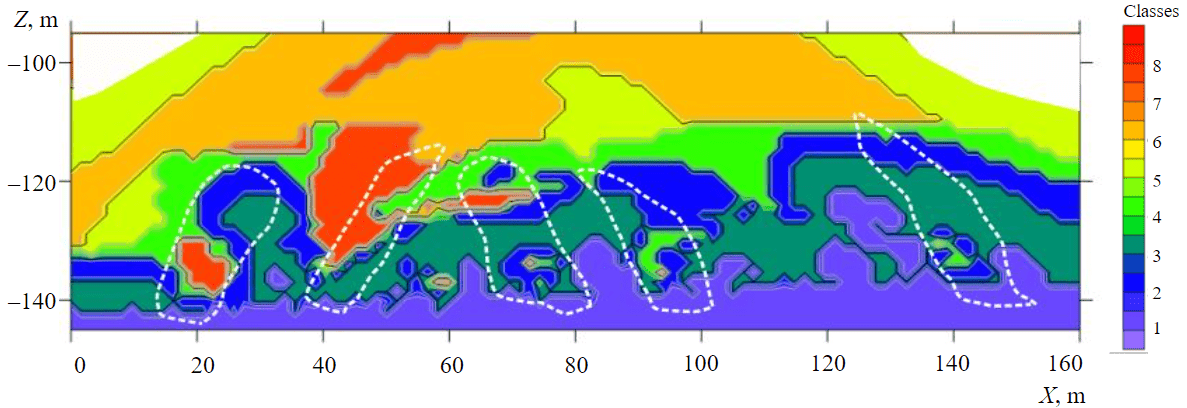
Fig.4. An interpretative model based on a priori information, transformation and classification of seismic data
Conclusion
When predicting the stress-strain state of a rock mass within the framework of mining planning, it becomes necessary to develop a methodological approach to data research and analysis with the involvement of additional tools. The geological conditions of the Talnakhskoe and Oktyabrskoe fields were considered as the object of research. The object under study is an underground mine under development in complicated operating conditions due to its sufficient proximity to the surface and the high probability of water inflow into the mine due to the development of hidden geomechanical processes.
As a result of seismic surveys, the technology for determining the nature of the propagation of elastic waves in the roof of the mine working was tested. Further work consisted in a sequential selection of qualitative data and testing of the methodology for complex processing and interpretation of seismic data using the method of transformation and classification analysis applied for geopotential fields. The novelty of the work lies in the use of effective tools that have proven themselves well when working with potential geophysical fields for data reflecting the elastic characteristics of the medium under study. This method is modernized and requires further testing on data obtained in more complex geological and technical conditions. In addition, the results demonstrate the potential for expanding the use of seismic survey technologies at the processing and interpretation stage compared with conventional approaches to analyzing profile data in the form of seismograms or images.
The proposed method of processing and interpreting seismic data with subsequent transformations and classification allows to proceed to the compilation of an interpretative model reflecting the position of the contours of the most dangerous zones (Fig.4). The interpretative model can serve as a basis for planning the safe conduct of underground mining operations, taking into account the identified intervals of increased geomechanical risk (decompressed areas, areas of stress, flooded areas).
Thus, the use of seismic data transformation in combination with the classification method in solving the problem of anomalous areas localization prone to the development of geomechanical risks makes it possible to quickly and most reliably identify areas that are dangerous from the point of view of intensification of geomechanical processes. The application of the seismic data transformation technique indicates the prospects of using modern geophysical technologies in modeling the behavior of a rock mass, taking into account the impact of operational and mechanical loads.
References
- Demenkov P.A., Romanova E.L. Analysis of approaches to calculation of vertical shaft support in tectonic disturbance zones. News of the Tula state university. Sciences of Earth. 2022. Iss. 4, p. 223-236 (in Russian).
- Abramkin N.I., Efimov V.I., Mansurov P.A. Empirical techniques for assessing rock massif condition. News of the Ural State Mining University. 2021. Iss. 4 (64), p. 109-115 (in Russian). DOI: 10.21440/2307-2091-2021-4-109-115
- Lomov M.A., Konstantinov A.V. Results analysis of seismic monitoring of the Kukisvumchorrskoye field. Problems of Subsoil Use. 2022. N 1 (32), p. 38-44 (in Russian). DOI: 10.25635/2313-1586.2022.01.038
- Chepelenkova V.D., Lisitsa V.V. Application of discrete element method to estimation of strength properties of elastic media. XVIII Mezhdunarodnyi nauchnyi kongress i vystavka “Interekspo GEO-Sibir”, 18-20 May 2022, Novosibirsk, Russia. Interekspo GEO-Sibir, 2022. Vol. 2. N 2, p. 209-214 (in Russian). DOI: 10.33764/2618-981X-2022-2-2-209-214
- Dashko R.E., Romanov I.S. Safety of mining in the Kupol deposit based on the analysis and evaluation of geological processes in underground mine (CHAO, Anadyr District). Eurasian Mining. 2022. N 1, p. 85-89. DOI: 10.17580/em.2022.01.18
- Kozyrev A.A., Savchenko S.N., Panin V.I. et al. Geomechanical processes in the geological environment of mining systems and geodynamic risk management. Apatity: Kolskii nauchnyi tsentr Rossiiskoi akademii nauk, 2019, p. 431 (in Russian). DOI: 10.37614/978.5.91137.391.7
- Alexandrov P.N., Krizsky V.N. Direct and Inverse Problem of Geoelectrics in Bianisotropic Media Based on Volume Integral Equations. Physics of the Solid Earth. 2022. Vol. 58. N 3, p. 379-393 (in Russian). DOI: 10.1134/S1069351322030016
- Rasskazov I.Ju., Saksin B.G., Potapchuk M.I., Anikin P.A. The Researches of Burst-Hazard on Mines in Russian Far East. ISRM European Rock Mechanics Symposium – EUROCK 2018, 22-26 May 2018, Saint Petersburg, Russia. OnePetro, 2018. N ISRM-EUROCK-2018-014.
- Lomov M.A., Sidlyar A.V. Estimation of rockburst hazard factors of the Nikolaev deposit with the use of 3D modelling results of seismoacoustic monitoring. Problems of Subsoil Use. 2021. N 1 (28), p. 64-72 (in Russian). DOI: 10.25635/2313-1586.2021.01.064
- Protosenya A.G., Iovlev G.A. Prediction of spatial stress-strain behavior of physically nonlinear soil mass in tunnel face area. Mining Informational and Analytical Bulletin. 2020. N 5, p. 128-139 (in Russian). DOI: 10.25018/0236-1493-2020-5-0-128-139
- Kutepova N.A., Moseykin V.V., Kondakova V.N. et al. Specificity of properties of coal processing waste regarding their storage. Mining Informational and Analytical Bulletin. 2022. N 12, p. 77-93. DOI: 10.25018/0236_1493_2022_12_0_77
- Lomov M. 3D modeling system of seismoacoustic monitoring results at the Nikolaevskoye field. VIII International Scientific Conference “Problems of Complex Development of Georesources”, 8-10 September 2020, Khabarovsk, Russia. E3S Web of Conferences, 2020. Vol. 192. N 04008. DOI: 10.1051/e3sconf/202019204008
- Izotova V., Petrov D., Pankratova K., Pospehov G. Research of Acoustic Characteristics and Physical and Mechanical Properties of Quaternary Soils. Engineering and Mining Geophysics. 2020. Vol. 2020, p. 7. DOI: 10.3997/2214-4609.202051130
- Fedotov S.A., Fedotov A.S. Optimization of seismic exploration technology in engineering and geophysical research. Inzhenernaya, ugolnaya i rudnaya geofizika-2015. Sovremennoe sostoyanie i perspektivy razvitiya, 28 sentyabrya – 2 oktyabrya 2015, Sochi, Rossiya. Sochi: Mezhregionalnaya obshchestvennaya organizatsiya Evro-Aziatskoe geofizicheskoe obshchestvo, 2015, p. 22-25 (in Russian).
- Fengqiao Zhang, Lotfollah Pahlavan, Yuguang Yang. Evaluation of acoustic emission source localization accuracy in concrete structures. Structural Health Monitoring. 2020. Vol. 19. Iss. 6, p. 2063-2074. DOI: 10.1177/1475921720915625
- Dolgal A.S., Kostitsyn V.I., Novikova P.N., Pugin A.V. Approximation algorithms of geopotential fields sourcewise functions. Journal of Geophysics. 2016. N 5, p. 4-10 (in Russian).
- Fuentes J. Unraveling Soft Squeezing Transformations in Time-Variant Elastic Fields. Dynamics. 2023. Vol. 3, Iss. 2, p. 299-314. DOI: 10.3390/dynamics3020018
- Bharti A.K., Prakash A., Verma A. et al. Mapping of decades-old underground coal mine workings using electrical resistivity tomography. Journal of Earth System Science. 2022. Vol. 131. Iss. 4. N 258. DOI: 10.1007/s12040-022-02008-7
- Alekseev S.G., Bochkov P.A., Senchina N.P., Shtokalenko M.B. The Indication in the Potential Fields of Structures Controlling Diamondiferous Magmatism. Practical and Theoretical Aspects of Geological Interpretation of Gravitational, Magnetic and Electric Fields: Springer Proceedings in Earth and Environmental Sciences Proceedings of the 45th Uspensky International Geophysical Seminar, Kazan, Russia. Springer: Cham, 2019, p. 331-338. DOI: 10.1007/978-3-319-97670-9_38
- Shabarov A.N., Kuranov A.D., Kiselev V.A. Assessing the zones of tectonic fault influence on dynamic rock pressure manifestation at Khibiny deposits of apatite-nepheline ores. Eurasian Mining. 2021. Vol. 36. Iss. 2, p. 3-7. DOI: 10.17580/em.2021.02.01
- Egorov A.S., Prischepa O.M., Nefedov Y.V. et al. Deep Structure, Tectonics and Petroleum Potential of the Western Sector of the Russian Arctic. Journal of Marine Science and Engineering. 2021. Vol. 9. Iss. 3. N 258. DOI: 10.3390/jmse9030258
- Sekerina D.D., Dergileva E.A., Egorov A.S. Location patterns of caledonianand hercynian orogeny structures, rudny Altai. Regional Geology and Metallogeny. 2023. N 93, p. 52-62 (in Russian). DOI: 10.52349/0869-7892_2023_93_52-62
- Schiffer C., Tegner C., Schaeffer A.J. et al. High Arctic geopotential stress field and implications for geodynamic evolution. Circum-Arctic Lithosphere Evolution. London: Geological Society of London, 2018. Vol. 460, p. 441-465. DOI: 10.1144/SP460.6
- Yakovleva A.A., Movchan I.B., Shaygallyamova Z.I. Dynamic response of multi-scale geophysical systems: waves and practical applications. Philosophical Transactions of the Royal Society A: Mathematical, Physical and Engineering Sciences. 2022. Vol. 380. Iss. 2237. N 20210403. DOI: 10.1098/rsta.2021.0403
- Krizsky V.N., Aleksandrov P.N., Kovalskii A.A., Viktorov S.V. Magnetometry-based mathematical modeling of transient resistance of cathode polarized pipeline. Science and Technologies: Oil and Oil Products Pipeline Transportation. 2022. Vol. 12. N 1, p. 68-79 (in Russian). DOI: 10.28999/2541-9595-2022-12-1-68-79
- Raguzin I.I., Bykova E.N., Lepikhina O.Yu. Polygonal Metric Grid Method for Estimating the Cadastral Value of Land Plots. Lomonosov Geography Journal. 2023. Vol. 78. N 3, p. 92-103 (in Russian). DOI: 10.55959/MSU0579-9414.5.78.3.8
- Kerimov I.A, Petrov A.V., Abubakarova E.A. The Use of Software Complex “Koskad 3D” to Analyze Potential Fields of Terek-Caspian Arch. Dagestan State Pedagogical University. Natural and Exact Sciences. 2018. Vol. 12. N 3, p. 88-96 (in Russian). DOI: 10.31161/1995-0675-2018-12-3-88-96
- Bogoslovsky V.A., Samokhin А.V., Zhigalin A.D. Ecological monitoring of underground gas storehouses with geophysical methods. Geoekologiya. Inzheneraya geologiya, gidrogeologiya, geokriologiya. 2011. N 5, p. 465-473 (in Russian).
- Kholmskii I., Eltsov T., Gulin V. et al. Real Time Monitoring of Seismic Survey Works Using Unmanned Aerial Systems. 83rd EAGE Annual Conference & Exhibition. 2022. Vol. 2022, p. 5. DOI: 10.3997/2214-4609.202210988
- Arkhipova E.V., Zhigalin A.D., Bryantseva G.V. et al. Features of long-term seismicity variations of active megastructures of the modern Earth. Bulletin of Dubna International University for Nature, Society, and Man. Series: Natural and Engineering Sciences. 2019. N 1 (42), p. 3-12 (in Russian).
- Popov M.G., Popova O.G. The possibility of complex studying for the geological environment during seismic-ecological monitoring in areas of increased environmental danger. Geology and Geophysics of Russian South. 2021. Vol. 11. N 2, p. 152-166 (in Russian). DOI: 10.46698/VNC.2021.29.52.011
- Bykowa E., Skachkova M., Raguzin I. et al. Automation of Negative Infrastructural Externalities Assessment Methods to Determine the Cost of Land Resources Based on the Development of a “Thin Client” Model. Sustainability. 2022. Vol. 14. Iss. 15. N 9383. DOI: 10.3390/su14159383
- Phan T.H., Petrov A.V., Do M.P. et al. Geological structure of central Vietnam by interpretation processing of gravitational survey data using the “COSCAD 3D” computer technology. Proceedings of higher educational establishments. Geology and Exploration. 2020. Vol. 63. N 5, p. 77-90 (in Russian). DOI: 10.32454/0016-7762-2020-63-5-77-90
- Dolgal A.S. Additive Technologies of Localization of the Geopotential Field Sources. Bulletin of Perm University. Geology. 2019. Vol. 18. N 4, p. 380-385 (in Russian). DOI: 10.17072/psu.geol.18.4.380
- Popov M.G., Popova O.G. Study of Changes in Time and in Space of Stressed State of Geological Environment. Geology and Geophysics of Russian South. 2020. Vol. 10. N 3, p. 79-93 (in Russian). DOI: 10.46698/VNC.2020.43.14.005
- Popova O.G., Popov M.G. Assessment of the geoenvironment stress state at the Caucasian mineral waters test plot using long-term seismic-ecological monitoring. Geoekologiya. Inzheneraya geologiya, gidrogeologiya, geokriologiya. 2019. N 5, p. 15-22 (in Russian). DOI: 10.31857/S0869-78092019515-22
- Shabarov A.N., Zubkov V.V., Krotov N.V. et al. Choice of design decisions on development of fields taking into account results of geodynamic division into districts and geometrizations of dangerous zones. Journal of Mining Institute. 2013. Vol. 205, p. 66-69 (in Russian).
- Balk P.I., Dolgal A.S., Pugin A.V. et al. Effective algorithms for sourcewise approximation of geopotential fields. Izvestiya, Physics of the Solid Earth. 2016. Vol. 52. Iss. 6, p. 896-911. DOI: 10.1134/S1069351316050025
- Liu Q., Gu Y.J. Seismic imaging: From classical to adjoint tomography. Tectonophysics. 2012. Vol. 566-567, p. 31-66.
- Putikov O., Kholmyanski M., Ivanov G., Senchina N. Application of geoelectrochemical method for exploration of petroleum fields on the Arctic shelf. Geochemistry. 2020. Vol. 80. Iss. 3. N 125498. DOI: 10.1016/j.geoch.2019.02.001
- Mingaleva T., Gorelik G., Egorov A., Gulin V. Correction of Depth-Velocity Models by Gravity Prospecting for Hard-to-Reach Areas of the Shelf Zone. Mining Informational and Analytical Bulletin. 2022. N 10-1, p. 77-86 (in Russian). DOI: 10.25018/0236_1493_2022_101_0_77
- Cheremisina E.N., Finkelshtein M.Ya., Deev K.V., Bolshakov E.M. GIS INTEGRO. Status and prospects for development in the context of import substitution. Russian Oil and Gas Geology. 2021. N 3, p. 31-40 (in Russian). DOI: 10.31087/0016-7894-2021-3-31-40
- Cheremisina E.N., Senner A.E. The use of GIS INTEGRO in searching tasks for oil and gas deposits. Computer Research and Modeling. 2015. Vol. 7. N 3, p. 439-444. DOI: 10.20537/2076-7633-2015-7-3-439-444
- Grigorev G., Islamuratov M., Bondarev E. et al. D-seis: digital field exploration twin. Second EAGE Digitalization Conference and Exhibition. 2022. Vol. 2022, p. 5. DOI: 10.3997/2214-4609.202239010
- Zaycev S.V., Ahmetsafin R.D., Budennyj S.A. et al. Usage of Machine Learning Algorithms for Structural Boundaries Reconstruction Using the Non-Seismic Methods Data with Feature Selection. Data Science in Oil and Gas. 2021. Vol. 2021, p. 6. DOI: 10.3997/2214-4609.202156005
- Buddo I.V., Shelokhov I.A., Misyurkeeva N.V., Agafonov Y.А. Transient electromagnetic sounding in 2D, 3D, and 4D modes: sequence of geological exploration activities. Geodynamics & Tectonophysics. 2021. Vol. 12. N 3S, p. 715-730 (in Russian). DOI: 10.5800/GT-2021-12-3s-0549
- Ponomarenko M.R., Kutepov Y.I., Volkov M.A., Grinuk A.P. Satellite methods within integrated land surface deformation monitoring in a mine field. Mining Informational and Analytical Bulletin. 2020. N 12, p. 103-113 (in Russian). DOI: 10.25018/0236-1493-2020-12-0-103-113