Depth distribution of radiation defects in irradiated diamonds by confocal Raman spectroscopy
- 1 — Masters in Physics Research Assistant Gemmological Institute of India ▪ Orcid
- 2 — Masters in Geophysics Research Assistant Gemmological Institute of India ▪ Orcid
- 3 — Masters in Chemistry Research Associate Gemmological Institute of India ▪ Orcid
- 4 — Masters in Chemistry Research Associate Gemmological Institute of India ▪ Orcid
- 5 — Masters in Physics Research Assistant Gemmological Institute of India ▪ Orcid
- 6 — Bachelor of Engineering Diamond Valuer and Trustee Gemmological Institute of India ▪ Orcid
- 7 — Ph.D., Dr.Sci. Head of department Gemmological Institute of India ▪ Orcid
Abstract
Five colored diamonds were investigated. According to the results of the study by FTIR, UV-Vis-NIR and Photoluminescence spectroscopy, they are natural type Ia diamonds. The depth distribution of the color intensity was carried out by measuring the intensity of the PL peak at 741 nm (GR1 center) upon excitation by a laser with a wavelength of 633 nm of Raman Confocal microscope. To minimise the perturbation due to geometrical effects, defect distribution profiles were normalised with respect to diamond Raman peak intensity (691 nm) point by point. For two diamonds, the intensity of the GR1 peak (741 nm) sharply decreased to a depth of 10 µm, and then became equal to the background level, which is typical for irradiation with alpha particles from natural sources like uranium. In other diamonds, the profiles vary slightly with depth, and the color intensity is close to uniform, which is for irradiation with accelerated electrons or neutrons. The source of radiation has not been determined. However, long duration radioactivity measurements of the diamonds suggested that neutrons were not used for colour centers production in the diamonds studied.
None
Introduction
Defects of intrinsic or impurity nature are known to impart color in many diamonds [1]. Colorless diamonds are the most expensive, but some fancy color diamonds are also in demand [2]. Research on bleaching of diamonds or enhancing the intensity of fancy colors remains relevant. The two most common methods used for this purpose are high-pressure high temperature (HPHT) treatment [3] and exposing diamonds to controlled doses of high energy ionizing radiations, often followed by HPHT treatment. Irradiation of diamonds with neutrons, energetic electrons, or α-particles creates radiation defects (vacancies and interstitial atoms) in the diamond, which absorb part of the visible spectrum. This leads to a change in the color of the diamond crystal from blue-green to brown [4]. A diamond would receive a radiation dose in natural conditions by contacting with natural radioactive substances, for example, uranium and its decay products [5]. The depth of penetration of α-particles into diamond does not exceed 30 µm. Thus during the contact irradiation with α-particles around the contact point, so-called pigmentation spots-colored areas would be formed.
To improve color of diamonds in the laboratory, they are exposed to high-energy electrons or γ-rays [6]. Energy of the radiation is so chosen such that exposure does not cause nuclear reactions to form residual radioactivity [7-11]. Range and energy of the radiation are crucial for choosing it for irradiation of diamonds. Color centers and their distribution in the bulk of crystals are usually investigated by spectroscopy. Typically, photoluminescence (PL) spectra of diamonds are obtained by excitation with a suitable laser. When using a laser with a wavelength of 633 nm, a noticeable observed feature in the PL spectrum of diamond exposed to ionizing radiation is a peak at 741 nm, corresponding to the center of the GR1 – neutral vacancy [12].
Confocal Raman spectroscopy with a spatial resolution of about 0.1 µm [13] is one of the universal tools for measuring the depth distribution of defects in thin films, polymer composites, solids, including diamonds, etc. Compared to other methods [14-16], confocal Raman microscopy gives poorer resolution, but other advantages make it very suitable for measuring the depth distribution of defects, especially for solids such as diamonds.
In this work, the depth distribution of defects in five colored diamonds was studied, and the characteristics of the IR and UV-visible regions were measured by spectroscopy. The aim of the work is to determine whether these crystals were exposed to ionising radiation.
Methods
Physical properties of the five samples investigated are given in Table.
Diamonds description
|
Name * |
Weight, carats** |
Colour |
Cut |
Type *** |
|
S.G.1 |
3.12 |
Tinted Green |
Rough |
Ia |
|
S.G.2 |
4.83 |
Tinted Green |
Rough |
Ia |
|
T.B.1 |
0.015 |
Blue |
R.B.C. |
IaA |
|
T.B.2 |
3.23 |
Blue |
Rough |
IaAB |
|
T.B.3 |
12.13 |
Bluish Green |
Rough |
Ia |
* Names of the samples are given, after initial investigations, as T.B. for treated diamonds and S.G. for diamonds exposed to short range radiation in the earth crust or in the lab.
** 1 carat = 200 mg.
*** Types of the diamonds are identified by FTIR spectral measurements.
Images of the diamonds
The optical images of the five diamonds were captured under white light by using Canon EOS 90D Digital SLR Camera with 18-135 IS USM Lens. Luminescence (fluorescence and phosphorescence) images for all the diamonds were obtained using the De Beers Diamond View which has an UV excitation source (≤ 230 nm). These images were used to examine the growth patterns.
Spectroscopic measurements
IR absorption measurements were made using Thermo Nicolet iS50 FTIR with DRIFT accessory and DLaTGS (deuterated L-alanine doped triglycine sulphate) detector. Spectra were recorded with 100 scans in the range of 8,000 to 400 cm–1 with a resolution of 4 cm–1 at room temperature.
UV-Vis absorption spectra were recorded in the range of 200 to 800 nm, with Cary Varian 5000 UV-Vis-NIR spectrometer having sources of Deuterium lamp for UV region and Tungsten Halogen for Visible and IR regions. This system has a PMT (photo multiplier tube) as the detector for UV-Visible region and polycrystalline lead sulfide (PbS) detector for IR region. Measurements were made at liquid nitrogen temperature, 77 K.
Photoluminescence spectra were measured with the Renishaw InVia Reflex Raman Spectrometer having confocal optics and CCD (charge coupled device) detector. We chose 100x objective lens that has a laser working distance of 0.33 mm between the lens and the sample. We used only two laser sources, 405 nm (for spectral range of 407 to 743 nm) and 633 nm (for spectral range 637 to 991 nm) for spectral studies. 633 nm laser source was chosen for defect distribution measurements. Spectral measurements were made at 77 K temperature. On the other hand, depth profile measurements were carried out at room temperature with an interval of 4 μm in air by tagging 741 nm peak (GR1 centre) using 633 nm laser. Measurements were carried out through an inbuilt software controlled programme.
The distribution of GR1 centre as a function of depth
Our confocal Raman spectrometer has a spatial resolution of 0.1 μm and higher. Z distance was changed stepwise using a motorised X-Y plane platform of the object (diamond sample) and Z movement was software controlled. A provision is available to acquire spectra up to 200 μm. Prolonged measurements at liquid nitrogen temperature result in precipitation of fog on the surface of the diamond and could affect PL signal. Hence, these measurements were carried out at room temperature. From the analysis of GR1 data as a function of depth on one diamond, showed that required information was obtained from the profiles in the depth range starting from 0 to 60 μm and therefore we collected data for all other diamonds from 0 to 60 μm.
Peak area analysis
Our confocal Raman spectrometer has an inbuilt Spectrum analysis programme. After acquiring the spectrum, the displayed spectrum was taken into analysis mode. This inbuilt programme has a provision in the tools “curve fit” which identifies peak position, calculates peak intensity (peak areas) and peak (centroid) counts, and the results for all the peaks are displayed. They contain both gross and background subtracted data. This inbuilt programme identifies both the minima counts on the left side and right side of a chosen peak (L and R), through an inbuilt software in which successive differentiation is used. Background counts corresponding to L and R channels are taken as a five point average around minima. Counts in the small interval between L and R is assumed to vary linearly. Thus the background for each peak is calculated by trapezium rule, peak area is computed by subtracting background from integrated area. In the case of peak counts, software recognizes the channel corresponding to that peak (centroid) and peak count is obtained by subtracting background corresponding to centroid.
Spectrum analysis was also carried out by us as a crosscheck using origin software (Gaussian). The results obtained by both origin and inbuilt programmes were reproducible.
The range of peak areas is from 80,000 to background level whereas for peak count it is 10,000 to background level. In all the cases the reported peak areas are much above background level and thus are significant.
Results and discussion
All the five diamonds investigated in this work were characterised by examining the images obtained by Diamond View as well as by spectroscopic techniques.
Diamond images
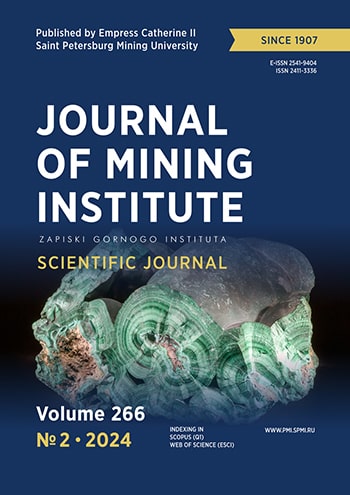
The optical images of the five diamonds are given in Fig.1. Luminescence images obtained by Diamond View are shown in Fig.2. In the Diamond View, all the diamonds except T.B.1 showed blue fluorescence with no phosphorescence, where as T.B.1 showed Green fluorescence with blue patches. The observed growth patterns confirmed that the diamonds are natural. The observed blue fluorescence is because of the presence of N3 centre (415 nm). Interestingly E.Vasilev et al. observed heterogeneous distribution of optical centres in a diamond along with blue fluorescence which was attributed to N3 centre [17].
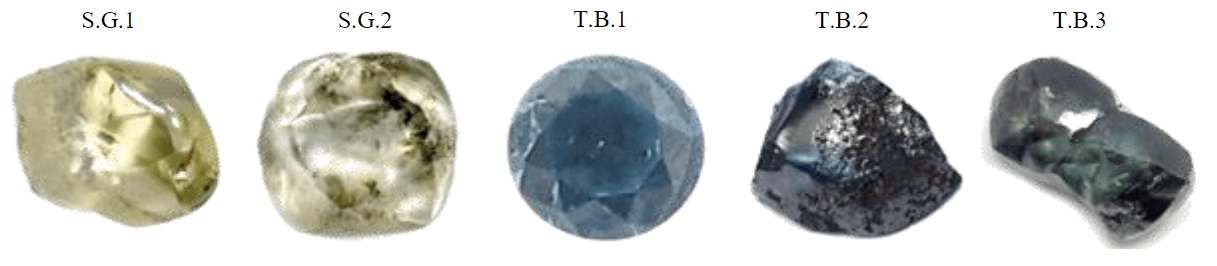
Fig.1. Optical images of diamonds investigated
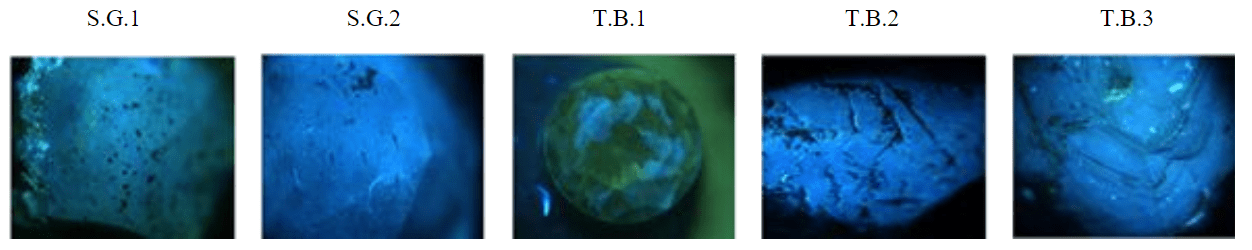
Fig.2. Luminescence images of diamonds under Diamond View (UV < 230 nm)
Fig.3. FT-IR Spectra of S.G.1, T.B.2 and T.B.3
FTIR spectra
IR absorption spectra were recorded to characterise diamonds and many investigators used FTIR to obtain absorption spectra for identifying and characterising the types of centres present in the diamonds [18, 19]. FTIR spectra of all the five diamonds showed signature peaks of type Ia natural diamonds corresponding to A (1282 cm–1) and B (1178 cm–1) centres which are due to nitrogen aggregation in diamonds. IR spectra of S.G.1, T.B.2 & T.B.3 are given in Fig.3 for spectral comparison. All the prominent absorption peaks in the spectra are labelled.
A broad band was observed around 482.33 cm–1 which is attributed to A centre. A sharp platelet peak was observed in the range of 1360 cm–1 to 1370 cm–1 and it is commonly associated with type Ia natural diamonds. Peaks at 3106 cm–1 and 1010.36 cm–1 were seen, as expected, generally in hydrogen containing diamonds which are due to carbon hydrogen (C–H) bond vibration. A weak peak at 1450.30 cm–1 (H1a centre) was present in T.B.2 and T.B.3, but absent in S.G.1. The observed H1a centre is due to electron beam irradiation and annealing [20]. The absence of H1a peak in the IR spectrum of S.G.1 could be that the diamond might not have been annealed after irradiation.
UV-Vis NIR spectra
The absorption spectra of the five diamonds were measured at 77 K temperature. Two spectra corresponding to S.G.1 and T.B.1 are given in Fig.4.
Spectra of S.G.1 & S.G.2 diamonds showed an absorption peak at 415 nm (N3) which is the most common feature of type Ia natural diamonds [21]. A weak peak at 503 nm due to H3 centre was also observed. Spectrum of S.G.1 had an absorption peak at 496 nm due to H4 centre. Both H3 and H4 centres occur in diamonds that are exposed to natural or artificial radiations.
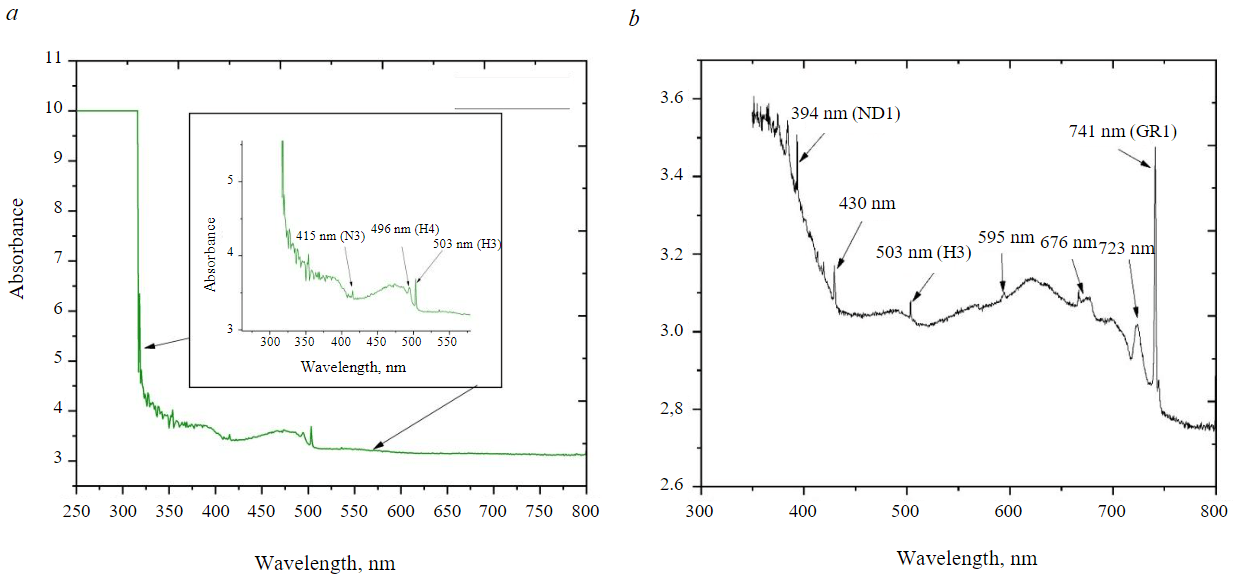
The absorption spectrum of T.B.3 has similar features like those observed in the spectrum of T.B.1 that showed a huge absorption in the region of 350-380 nm. It is observed that in the absorption spectra of diamonds T.B.1, T.B.2 and T.B.3, the most prominent peak was found at 741 nm which is due to GR1 centre. It is an artefact of exposure of diamonds to ionising radiation (natural or artificial) [12]. Peak at 394 nm (ND1 centre) was present in T.B.1 and T.B.3, and weak signals at 430, 503 and 723 nm were also seen. G.Davies and A.T.Collins [22] reported that more neutral vacancies V0 (GR1 centre) were present than those of V– (ND1 centre) in the diamonds exposed to electron beam irradiation followed by annealing. A peak at 595 nm was seen in the absorption spectra of T.B.1 and T.B.3 which is attributed to primary radiation damage and annealing. A similar observation was made by A.Osvet et al. and they reported that these defects were also created by neutron irradiation in type Ia natural diamonds [23]. Peaks at 676 and 723 nm were observed in T.B.1 and T.B.3 spectra which are due to exposure to high energy radiation and subsequent annealing at high temperature. However, it could not be seen in the absorption spectrum of intense blue coloured T.B.2 diamond. In this case absorption was saturated in the regions of 200 to 400 nm and 550 to 670 nm, and thus the peaks expected at 394, 595 and 676 nm were engulfed.
Photoluminescence spectra
Luminescence (photo-, cathodo-, thermo-luminescence etc.) spectra of diamond provide characteristic emission peaks for identification of colour centres and defects [24-28]. PL spectra of the five diamonds were measured at liquid nitrogen temperature (77 K) using 405 nm and 633 nm laser excitations and are given in Fig.5.
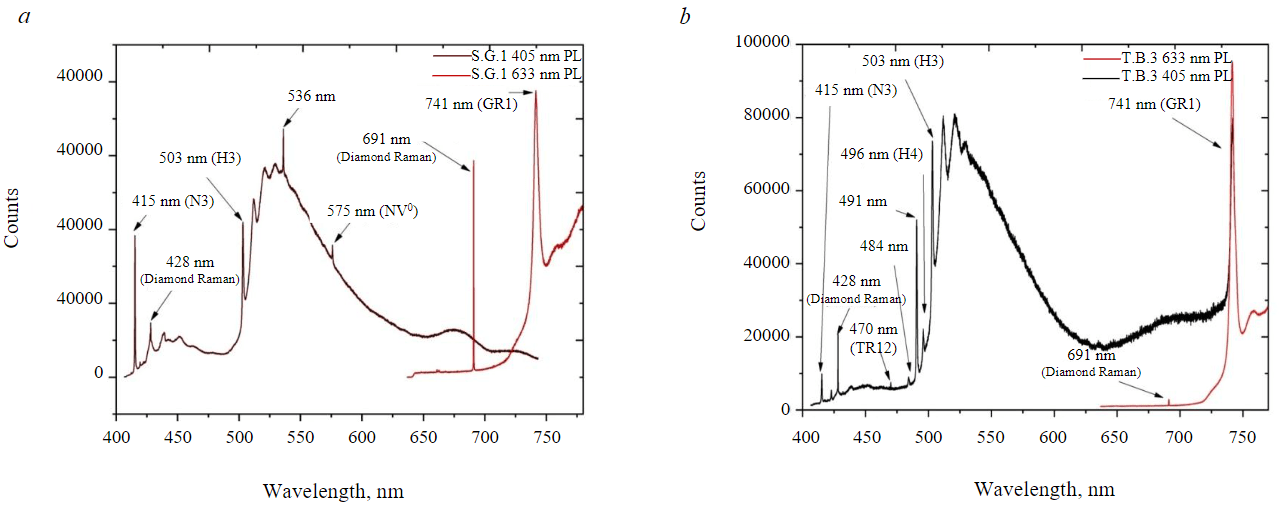
Fig.5. PL spectra of S.G.1 (а) and T.B.3 (b) with 405 and 633 nm laser excitations
PL spectra of diamonds obtained with 405 nm laser excitation showed an intense peak at 415 nm, due to strong N3 centre. Presence of this peak in all the five spectra indicates that these diamonds are natural diamonds which is a corroboration to IR and UV spectral observations. Photoluminescence spectra of diamonds S.G.1 and S.G.2 showed peaks at 415 nm (N3) and 503 nm (H3). PL spectrum of S.G.1 also showed a peak at 536 nm which is present in natural diamonds. This is an indication of radiation damage. A weak peak at 470 nm (TR12 centre) is also observed in the spectrum of T.B.3. It is reported that TR12 occurs due to high energy irradiation of both natural and synthetic diamonds [29]. The observed peak at 575 nm is due to the presence of NV0 centre. This centre is reported to be present in the nitrogen-containing natural and synthetic diamonds. An intense PL Peak at 503 nm corresponding to H3 centre was present in the spectra of all the diamonds except that of S.G.2. A feeble peak at 503 nm could be observed for S.G.2 using a higher laser power of 10 % (36 mW) instead of 1 % (3.6 mW) used for other diamonds.
Distribution of GR1 centre as a function of depth
Methods for changing the colour of the diamond were evolved over the years and reviewed by various investigators [11, 30, 31]. Uniform surface colo-ration can be achieved if the diamond is completely covered by uranium mineral or with an alpha source in a laboratory. Such exposures resulting in uniform colouration of the diamond might rarely occur in the earth’s crust. On the other hand, diamonds exposed to artificial ionising radiations like high energy electron beams produce colour centres throughout the bulk [4]. Exposure of diamonds to high energy neutrons or electrons cause changes in the diamonds and these changes were studied before and after annealing the diamonds [25]. Depth and intensity of the colour depends on the energy and exposure dose of the ionising radiation respectively. It is also possible that the irradiated diamonds might be subjected to HPHT to optimise colour intensity [30]. In the case of diamonds, GR1 centres are expected to be produced along the path of the interaction of ionising radiations. While treating with artificial irradiation, generally care is taken to expose diamonds from all the directions so that colour is imparted in the entire volume of the diamond. Therefore depth profiles in coloured diamonds in the present work were measured from different directions using confocal Raman microscope.
A series of spectra as a function of depth were acquired to visualise 3D picture of the defect distribution (Fig.6).
In all the spectra, peak areas and peak counts at the centroid corresponding to GR1 centre (741 nm) as well as diamond Raman line (691 nm) were computed. By examining the data, it is clear that qualitatively the distributions obtained using peak area and peak counts for a chosen diamond are similar, and nearly parallel. Therefore in further analysis, only peak counts as a function of depth were used.
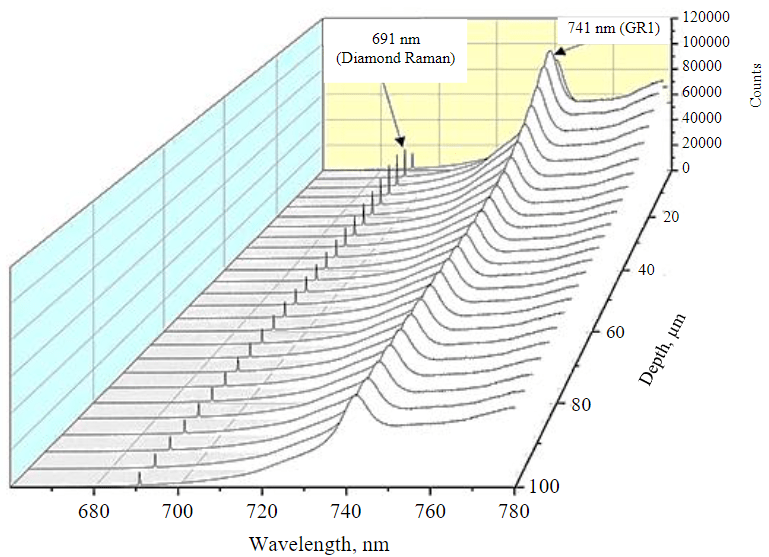
Fig.6. Spectra as a function of Depth of T.B.2 with 633 nm laser excitation
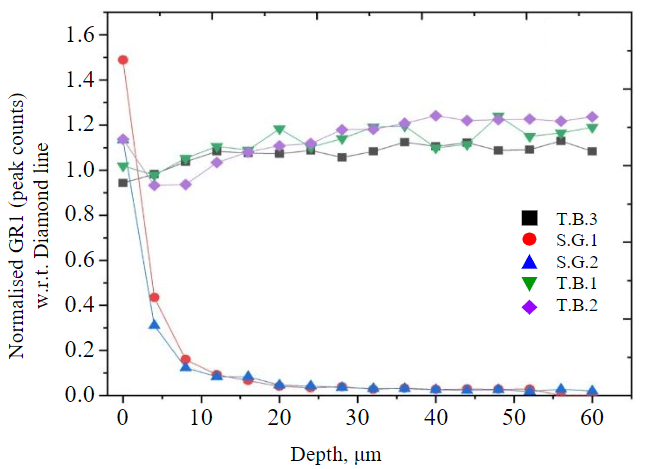
Fig.7. Depth profile of all diamonds using normalised GR1 peak counts
N.J.Everall [13] and N.A.Freebody et al. [32] reported a detailed description to obtain precise depth profiles using confocal Raman microscopy and stated that the resolution obtained is inferior compared to other techniques. As the aim of the present investigation is to examine the GR1 defect distribution for the type of radiation used and not to determine the exact depth, quality of resolution was not an influencing factor in this study.
Peak counts were normalised in situ with respect to intensity of one of the emission lines, which is present in the same spectrum. In a similar situation, pertaining to nuclear fission and nuclear reaction studies [33, 34] one of the authors used an internal normalisation method. Only condition was that the chosen emission line (in γ-spectrometry) should be present in every spectrum and has to have a correlation to the reaction under study. Similar treatment was applied in the present studies as each spectrum has a Raman diamond line, peak intensity of which depends on the laser intensity, diamond weight, detection efficiency etc. Therefore diamond line has been used for in situ normalising the intensity of 741 nm peak, point by point as a function of depth. On this premise, GR1 data were divided point by point by corresponding Raman peak areas that were normalised with respect to laser power. A similar normalisation procedure was used by S.C.Lawson et al [35] and E.A.Vasiliev et al. [36]. Normalised data were used to obtain defect distributions which are given in Fig.7.
From Fig.7 it is clear that in the profiles of S.G.1 and S.G.2 intensity decreased drastically initially and later became nearly a parallel line to X-axis with slow (no change) in the peak counts as a function of depth. Thus both the curves showed two distinct slopes, a rapid reduction in the peak counts up to 10 μm and from there onwards with slow (no change). This indicates that the colour of the diamonds is only a few μm deep from the surface. This confirms that these two diamonds might have been exposed to short range α-radiations. Thus the presence of GR1 centre could be due to interaction of α-rays, with diamond, either produced from an α emitting source like Uranium in earth’s crust or from an α emitting source in the laboratory. This also could be achieved in the laboratory by exposing diamonds to low energy heavy ion beams. Observed uniform colouration indicates that these diamonds could have been further treated.
Defect distribution profiles of other three diamonds are also given in Fig.7 with squares (T.B.3), inverted triangles (T.B.1) and rhombuses (T.B.2). In all the three profiles, an initial slow rise is observed up to around 10 μm and there onwards started decreasing slowly [37]. Initially the laser working distance is kept at maximum which corresponds to surface (zero depth) of the diamond. Thus the peak area and peak counts corresponding to GR1 are due to excitation by laser and emission of GR1 from the atoms on the surface of the sample. As the laser is brought closer to the diamond surface, laser beam penetrates more depth in the diamond and interacts with more GR1 centres resulting in an increase of intensity of GR1 peak. It is possible that some of the 741 nm photons, while penetrating through the diamond layers might get self-attenuated before coming out of the surface, that results in the reduction of intensity. It is also possible that other defects in the diamonds, if present in the path could also influence the intensity by absorbing emitted PL photons. Net result is an increase in the intensity of 741 nm PL peak.
After reaching a maximum intensity, rate of emission of 741 nm (GR1 centre) could become constant with the depth whereas self-attenuation of these photons and loss due to absorption by other defects will continue. This might result in a slow decrease in the intensity of 741 nm as a function of depth as shown in Fig.7.
From this, the depth of GR1 in S.G.1 and S.G.2 diamonds was estimated as about 10 μm. In the case of artificially irradiated diamonds the near parallel curves (lines) to X axis suggest that the radiation effect is nearly uniform. This could be due to the volumetric effect of artificial irradiation of diamonds and/or diamonds after exposure could have been further treated. It is possible that the observed decrease in the intensity (Fig.7) could be used to find out the range of the radiation used. However, no attempt is made to calculate the same, as it is not the main objective of these studies.
Conclusions
Five coloured diamonds were investigated to find out whether they were exposed to natural/artificial radiation. IR, UV-Vis and PL spectral studies were used to characterise these diamonds as type Ia natural diamonds. From UV-Vis and PL spectra, it was found that three diamonds were exposed to long range artificial radiation. This was further confirmed from the measured defect distribution profiles of all the five diamonds, measured by tagging PL peak at 741 nm (GR1 centre) using Confocal Raman Microscope with laser 633 nm as an excitation source. GR1 depth distributions of S.G.1 and S.G.2 diamonds showed two slopes, one corresponding to the contact of diamonds with materials like uranium and its daughter products in the earth’s crust which emit short ranged ionising α particles as well as long ranged β and γ rays. Second slope is due to exposure to only long ranged β and γ rays. It is also possible that these diamonds might have been exposed to α-radiations from alpha sources like uranium, in the laboratory. As a function of depth, the second part of the curve became nearly parallel to X-axis. In the case of T.B.1, T.B.2 and T.B.3 diamonds, depth distribution profiles showed initial rise up to 10 μm and later a slow decrease was observed. When normalised with respect to diamond line intensity, the curves became nearly parallel to X-axis. This indicates that the GR1 centres are present uniformly throughout the volume of these diamonds. This could have been achieved by exposing to ionising radiations like long ranged electron beam followed by annealing.
References
- Magaña S.E., Ardon T., Smit K.V. et al. Natural-Color Pink, Purple, Red, and Brown Diamonds: Band of Many Colors. Gems & Gemology. 2018. Vol. 54. N 4, p. 352-377. DOI: 10.5741/GEMS.54.4.352
- King J.M. Gems & Gemology in Review: Coloured Diamonds. Carlsband: The Gemological Institute of America, 2006. 317 p.
- Fisher D. Brown diamonds and high pressure high temperature treatment. Lithos. 2009. Vol. 112. S. 2, p. 619-624. DOI: 10.1016/j.lithos.2009.03.005
- Campbell B., Mainwood A. Radiation Damage of Diamond by Electron and Gamma Irradiation. Physica status solidi (a). 2000. Vol. 181. Iss. 1, p. 99-107. DOI: 10.1002/1521-396X(200009)181:1<99::AID-PSSA99>3.0.CO;2-5
- Vasilev E.A., Kozlov A.V., Petrovsky V.A. Volume and Surface Distribution of Radiation Defect in Natural Diamonds. Journal of Mining Institute. 2018. Vol. 230, p. 107-115. DOI: 10.25515/PMI.2018.2.107
- Shigley J.E. Gems & Gemology in Review: Treated Diamonds. Carlsband: The Gemological Institute of America, 2005. 301 p.
- Desai S.N. Radiation induced colour enhancement of diamonds. International conference on peaceful uses of atomic energy, 29 September – 1 October 2009, New Delhi, India. Proceedings of international conference on peaceful uses of atomic energy, 2009. Vol. 2, p. 589-590.
- Sahavat S., Kornduangkaeo A., Thongcham K. et al. Color Enhancement of Natural Type Ia Diamond Using a Neutron-Irradiation and Annealing Method. Kasetsart Journal (Natural Science). 2009. Vol. 43. Iss. 1, p. 216-229.
- Crookes W. On the Action of Radium Emanations on Diamond. Proceedings of the Royal Society of London. 1904. Vol. 74. Iss. 497, p. 47-49. DOI: 10.1098/rspl.1904.0077
- Jaewon Park, Jaehyung Lee, Changwon Sohn, Byungho Choi. Patent N 7604846 US. Manufacturing method of colored diamond by ion implantation and heat treatment. Publ. 20.10.2009.
- Khmelnitsky R.A., Dravin V.A., Tal A.A. et al. Damage accumulation in diamond during ion implantation. Journal of Materials Research. 2015. Vol. 30. Iss. 9, p. 1583-1592. DOI: 10.1557/jmr.2015.21
- Clark C.D., Norris C.A. Photoluminescence associated with the 1.673, 1.944 and 2.498 eV centres in diamond. Journal of Physics C: Solid State Physics. 1971. Vol. 4. N 14, p. 2223-2229. DOI: 10.1088/0022-3719/4/14/036
- Everall N.J. Modelling and Measuring the Effect of Refraction on the Depth Resolution of Confocal Raman Microscopy. Applied Spectroscopy. 2000. Vol. 54. Iss. 6, p. 773-782. DOI: 10.1366/0003702001950382
- Suzuki S., Kakita K. A Comparative Study of GDOES, SIMS and XPS Depth Profiling of Thin Layers on Metallic Materials. Journal of Surface Analysis. 2005. Vol. 12. Iss. 2, p. 174-177.
- Babu S.R., Preisser N., Michelic S.K. Image Processing Procedure to Evaluate Inclusion Dissolution in a Slag Observed by High-Temperature Confocal Scanning Laser Microscopy. Metals. 2022. Vol. 12. Iss. 4. N 531. DOI: 10.3390/met12040531
- Datta J., Biswas H.S., Rao P. et al. Study of depth profile of hydrogen in hydrogenated diamond like carbon thin film using ion beam analysis techniques. Nuclear Instruments and Methods in Physics Research Section B: Beam Interactions with Materials and Atoms. 2014. Vol. 328, p. 27-32. DOI: 10.1016/j.nimb.2014.02.127
- Vasilev E., Petrovsky V., Kozlov A. et al. The story of one diamond: the heterogeneous distribution of the optical centres within a diamond crystal from the Ichetju placer, northern Urals. Mineralogical Magazine. 2019. Vol. 83. Iss. 4, p. 515-522. DOI: 10.1180/mgm.2019.32
- Collins A.T., Spear P.M. Optically active nickel in synthetic diamond. Journal of Physics D: Applied Physics. 1982. Vol. 15. N 12, p. L183-L187. DOI: 10.1088/0022-3727/15/12/006
- Collins A.T. Optical Centres Produced in Diamond by Radiation Damage. New Diamond and Frontier Carbon Technology. 2007. Vol. 17. N 2, p. 47-61.
- Woods G.S., Collins A.T. The 1450 cm–1 infrared absorption in annealed, electron-irradiated type I diamonds. Journal of Physics C: Solid State Physics. 1982. Vol. 15. N 26, p. L949-L952. DOI: 10.1088/0022-3719/15/26/013
- Yeliseyev A.P. Thermostimulated Luminescence and Delayed Luminescence of Natural Diamonds: Avtoref. dis. … kand. fiz.-mat. nauk. Sverdlovsk: Ural'skii politekhnicheskii institut im. S.M. Kirova, 1977, p. 20 (in Russian).
- Davies G., Collins A.T. Vacancy complexes in diamond. Diamond and Related Materials. 1993. Vol. 2. Iss. 2-4, p. 80-86. DOI: 10.1016/0925-9635(93)90035-Z
- Osvet A., Palm V., Sildos. I. Spectral hole burning and uniaxial stress study of radiation‐induced defects in diamond. Journal of Applied Physics. 1996. Vol. 79. Iss. 11, p. 8290-8293. DOI: 10.1063/1.362469
- Breeding C.M., Eaton-Magña S., Shigley J.E. Natural-Color Green Diamonds: A Beautiful Corundum. Gems and Gemology. 2018. Vol. 54. N 1, p. 2-27. DOI: 10.5741/GEMS.54.1.2
- Hainschwang T., Respinger A., Notari F. et al. A comparison of diamonds irradiated by high fluence neutrons or electrons, before and after annealing. Diamond and Related Materials. 2009. Vol. 18. Iss. 10, p. 1223-1234. DOI: 10.1016/j.diamond.2009.04.011
- Vasilev E., Kriulina G., Klepikov I. Luminescence of natural diamond in the NIR range. Physics and Chemistry of Minerals. 2020. Vol. 47. Iss. 7. N 31. DOI: 10.1007/s00269-020-01099-2
- Sastry M.D., Gaonkar M.P., Nagar Y.C. et al. Optically stimulated luminescence (OSL) and laser excited photo luminescence of electron beam treated (EBT) diamonds: Radiation sensitization and potential for tissue equivalent dosimetry. Diamond and Related Materials. 2011. Vol. 20. Iss. 8, p. 1095-1102. DOI: 10.1016/j.diamond.2011.06.012
- Vasilev E., Zedgenizov D., Zamyatin D. et al. Cathodoluminescence of Diamond: Features of Visualization. Crystals. 2021. Vol. 11. Iss. 12, p. 1522. DOI: 10.3390/cryst11121522
- Davies G., Foy C., O’Donnell K. The TR12 vibronic band in diamond. Journal of Physics C: Solid State Physics. 1981. Vol. 14. N 28, p. 4153-4165. DOI: 10.1088/0022-3719/14/28/016
- Collins A.T., Kanda H., Kitawaki H. Colour changes produced in natural brown diamonds by high-pressure, high-temperature treatment. Diamond and Related Materials. 2000. Vol. 9. Iss. 2, p. 113-122. DOI: 10.1016/S0925-9635(00)00249-1
- Collins A.T. The colour of diamond and how it may be changed. The Journal of Gemmology. 2001. Vol. 27. Iss. 6, p. 341-359. DOI: 10.15506/jog.2001.27.6.341
- Freebody N.A., Vaughan A.S., Macdonald A.M. On optical depth profiling using confocal Raman spectroscopy. Analytical and Bioanalytical Chemistry. 2010. Vol. 396. Iss. 8, p. 2813-2823. DOI: 10.1007/s00216-009-3272-0
- Reddy A.V.R., Goswami A., Tomar D.S. et al. Charge Distribution in 96 MeV 16O Induced Fission of 238U. Radiochimica. Acta. 1994. Vol. 64, p. 149-154. DOI: 10.1524/ract.1994.64.34.149
- Acharya R., Nair A.G.C., Reddy A.V.R., Goswami A. Standard-less analysis of Zircaloy clad samples by an instrumental neutron activation method. Journal of Nuclear Materials. 2004. Vol. 326. Iss. 2-3, p. 80-85. DOI: 10.1016/j.jnucmat.2003.12.013
- Lawson S.C., Spear P.M., Martineau P.M. Patent N EP1430291B1. Examining a diamond. Publ. 14.02.2007.
- Vasilev E.A., Ivanov-Omskii V.I., Pomazanskii B.S., Bogush I.N. The N3 center luminescence quenched by nitrogen impurity in natural diamond. Technical Physics Letters. 2004. Vol. 30. N 10, p. 802-803. DOI: 10.1134/1.1813714
- Ardalkar R., Salunkhe Y., Gaonkar M. et al. Depth profile studies on natural and artificially irradiated diamonds. 71st Diamond conference (Poster-45) 6-10 July 2021, Warwick U.K, University of Warwick, Coventry.