
Geomechanical analysis of the impact of the new tunnels construction in the vicinity of existing underground subway structures on the state of the soil massif
- 1 — Ph.D. Associate Professor National University of Science and Technology “MISIS” ▪ Orcid
- 2 — Ph.D., Dr.Sci. Professor National University of Science and Technology “MISIS” ▪ Orcid
Abstract
The specificity of the behavior of the soil massif near the tunnel under construction in difficult mining conditions is considered. It was revealed through the joint interpretation of the results of geophysical measurements in the tunnel and computer simulation. The results of field geophysical studies to identify areas of decompacted soil behind the lining in two existing tunnels during successive drilling of two new tunnels under them are described. A method to analyze the response of the lining to impact was used providing for the calculation of its energy. It has been established that the decompaction zones are mainly located in the lateral lower areas of the tunnel. To substantiate the mechanism of formation of cavities, computer simulations were carried out using the finite element method with the COMSOL Multiphysics software. The finite element model is built on the Drucker – Prager criterion in the variant of a two-dimensional problem statement. It is shown that at the initial position of two old tunnels, the areas of decompaction can develop mainly on the sides. The position of the zones changes significantly when excavating two new tunnels. Soil decompaction zones appear between the tunnels and there is a tendency for the areas to spread to the upper point of the tunnel. According to geophysical data time delays in the impact of new tunnels on the existing line are noted, as well as a decrease in the size of decompacted soil areas over time. There is a satisfactory agreement between the positions of the decompaction areas and voids obtained by the geophysical method and the results of numerical simulation.
This work was financially supported by the Russian Foundation for Basic Research (project N 20-05-00341)
Introduction
Excavating of workings in difficult mining and technological conditions is one of the most acute problems of underground construction. Publications on this topic often talk about the impact of tunneling on the soil massif and its surface [1-3], the interaction of tunnels under construction with buildings on the surface [4-6] and with urban infrastructure (roads, collectors) [7]. Other studies reflect the issues of the interaction of new tunnels with those already in operation [8, 9] and the choice of technology for the construction of several tunnels that affect each other. They consider the construction of parallel tunnels [10, 11], two tunnels at different depths [12], as well as an analysis of the behavior of twin tunnels [13] and vertically aligned twin tunnels [14]. A separate topic is construction in difficult geological conditions [15].
Construction safety in these cases is implemented using predictive models of massif behavior. Analytical solutions [16], field studies [17, 18], various statistical approaches [19, 20], numerical [10, 21, 22], and physical modeling [13, 19, 23] are often used here.
Validation of predictive models is more often carried out through geodetic surface measurements, which make it possible to monitor the deformations of the day surface, as well as through intra-tunnel measurements [24, 25], which monitor the settlement of rings. Geophysical validation and monitoring are used less often [26]. At the same time, geophysics can provide additional information about the state of the soil massif, which is desirable to use for analyzing its state.
If the study of models speaks of high accident risks, they change the construction technology and its parameters [7, 12] (in particular, the rate of penetration, axial load, weight pressure, parameters of the cement slurry [12, 21, 27]), and more carefully monitor compliance with the parameters of penetration [28].
The occurrence of cavities in the space behind the lining is one of the significant problems in the construction and operation of tunnels. They can lead to critical deformations of the lining and rail track, precipitation of the daylight surface, asymmetric stress-strain state of the soil massif around the tunnel, and affect the surrounding buildings [22, 29, 30]. The combination of complex mining and technological conditions and the presence of cavities can significantly increase the risk of an emergency. Therefore, research is being carried out both in the direction of assessing the specific impact of the cavity on various structures [31], and in the direction of developing methods for identifying cavities behind the lining for the purpose of their subsequent plugging [32].
The most common approach for searching for cavities are geophysical methods, in particular Impact-Echo (IE) and Impulse Response (IR), ground-penetrating radar [33-35]. IR is implemented as an analysis of the impact response of the lining. The response has been recorded by the seismic equipment. Further, the decision about the presence of a cavity behind the lining is based on the parameters calculated from the signals, for example, the signal amplitude, its energy, damping of the response oscillations. A lining that is not damped by the soil oscillates more freely if a cavity is present. This leads to an increase in the signal energy and a decrease in the attenuation of the oscillations. The IE method uses the registration of standing waves in the lining, also excited by impact, but the echo parameters are different compared to IR. The reflection coefficient at the lining-soil boundary increases if there is a cavity behind the lining. This leads to more pronounced resonance phenomena.
The method of high-frequency ground penetrating radar (GPR) involves the use of pulsed electromagnetic radiation. The wave packet emitted by the antenna is reflected from the boundaries in the lining and the soil massif and is recorded by the receiving antenna. The presence of a cavity changes the parameters of the recorded signals [36]. The general direction of the described methods development (IE, IR, GPR, etc.) has been carried out in the field of application of various methods for processing the received signals and methods for extracting informative parameters and attributes from them [32, 37-42] in recent years.
A review of publications showed the following. The analysis of changes in the soil massif during the construction of tunnels in complex mining and geological conditions is often either work with predictive models corrected by field studies of surface deformations, or analysis of only geophysical studies both from the tunnel and from the surface. Articles on the joint interpretation of models and results of geophysics are relatively rare. A similar study is presented in this article.
The purpose of the work is to analyze the behavior of a soil massif in a complex mining situation, which implies the prediction of cavities behind the lining using joint geophysical surveys and finite element modeling.
Methodology
The object of the study is a soil massif around several tunnels of the Moscow metro. The massif is composed of alluvial-fluvioglacial deposits (clays, loams, fine and medium sands). By the time the geophysical surveys were carried out, the rock massif section already contained a constructed metro line, consisting of two tunnels (Fig.1). The designations “path I” and “path II” will be used for these tunnels. The new branch was designed below the level of the built branch also consisting of two tunnels (Fig.1). For these tunnels, the designations “LATT” and “RATT” are used. These abbreviations mean the left and right auxiliary technological tunnels that passed one after the other. In October – June 2017, LATT was completed, in March – April 2018, the RATT was completed. The designations of the tunnels “path I”, “path II” for existing tunnels and “LATT”, “RATT” for those under construction correspond to the nomenclature adopted in the working documentation. The operating tunnels were at a depth of 10.5 m, and those under construction at 18.3 m (at the level of the tray). The diameters of the tunnels were 5.9 m. At the intersection of the branches, the minimum distance from the tray of the old tunnels to the upper points of the new ones was only 3 m.

Fig.1. The location of the tunnels on the plan with indication of survey areas (when drilling RATT). Section A-A shows a section where all four tunnels are present in one space
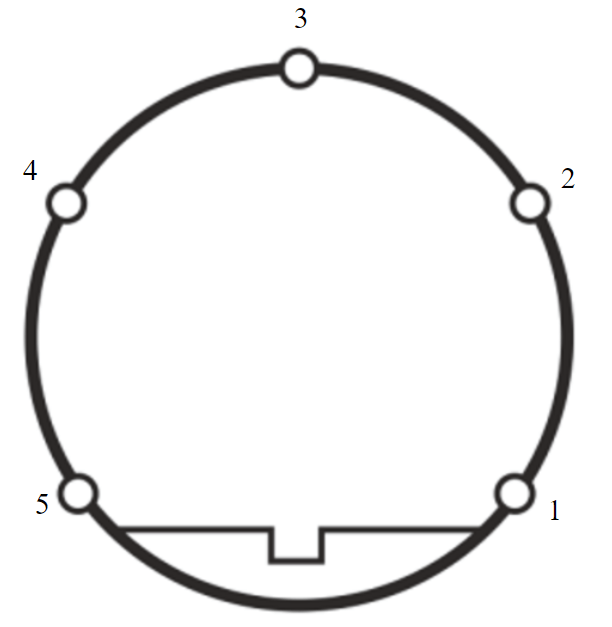
Fig.2. Layout of points with indication of their numbers n on one lining ring
Such a complex technological situation consisting of four closely spaced tunnels (two operating and two under construction tunnels) required a two-time suspension of the operation of the existing metro for several days and monitoring during the tunneling process. Monitoring consisted of continuous mine surveying and periodic geophysical surveys. Geophysical surveys were carried out to identify cavities in the field behind the lining. The survey was conducted from the inner space of the tunnel point by point using the IR method. The layout of testing points with their numbers n on the lining ring is shown in Fig.2. The site was surveyed by several similar sections with a step of 5 m. During the survey, a seismic vibration sensor was applied to the lining at the testing point. A series of five blows was applied next to it at a distance of 20-30 cm. The response of the lining to the impact was recorded by a digital seismic station and averaged. The lining had to behave as a membrane not pressed by the soil, if there was a cavity behind the lining. This led to the fact that the amplitude of the response increased, and the attenuation of the oscillatory signal decreased.
A number of informative parameters (attributes) capable of indicating the presence of a cavity behind the lining were extracted from them during processing of the recorded response signals. The most commonly used energy parameter
where mmax is the number of samples in the registered signal; Ai is the ith amplitude value of the signal; Dt is the sampling interval in time.
The energy parameter E integrally takes into account both the increase in amplitude and the lengthening of the signal in time, associated with a decrease in attenuation [15, 43].
Geophysical measurements were carried out in separate cycles. Five cycles were carried out during LATT excavation, and four cycles were carried out during RATT excavation. The cycles of geophysical measurements are described in Table 1 and they are designated according to the principle: L1 ‒ the first cycle of measurements during the boring of LATT; R1 ‒ the first cycle of measurements during the boring of the RATT. The control cycles L5c and R4c were carried out after a long period of time after construction. These diagrams should be read as follows. The moments L1 and L2 mean that paths I and II are already in the cross section A-A, and the TBM rotor (a circle with a crosshair) is in front of the section. The moments of the measurement cycles L3 and L4 mean that the rotor has just passed through the section A-A and moved on. Since the tunnel has already appeared in section A-A by this moment, it is shown with a dotted circle. When excavating the RATT, the LATT tunnel has already been built, so it is immediately shown in the diagrams. For the R1 cycle, the rotor, similarly to the L1 cycle, is located in front of the A-A section. For cycle R2 it approaches the section. For cycles R3 and R4, the tunnel had been already built in the section (dashed line). The rotor at this moment was behind this section.
Table 1
The location of the workings and the rotor of the shield during measurements
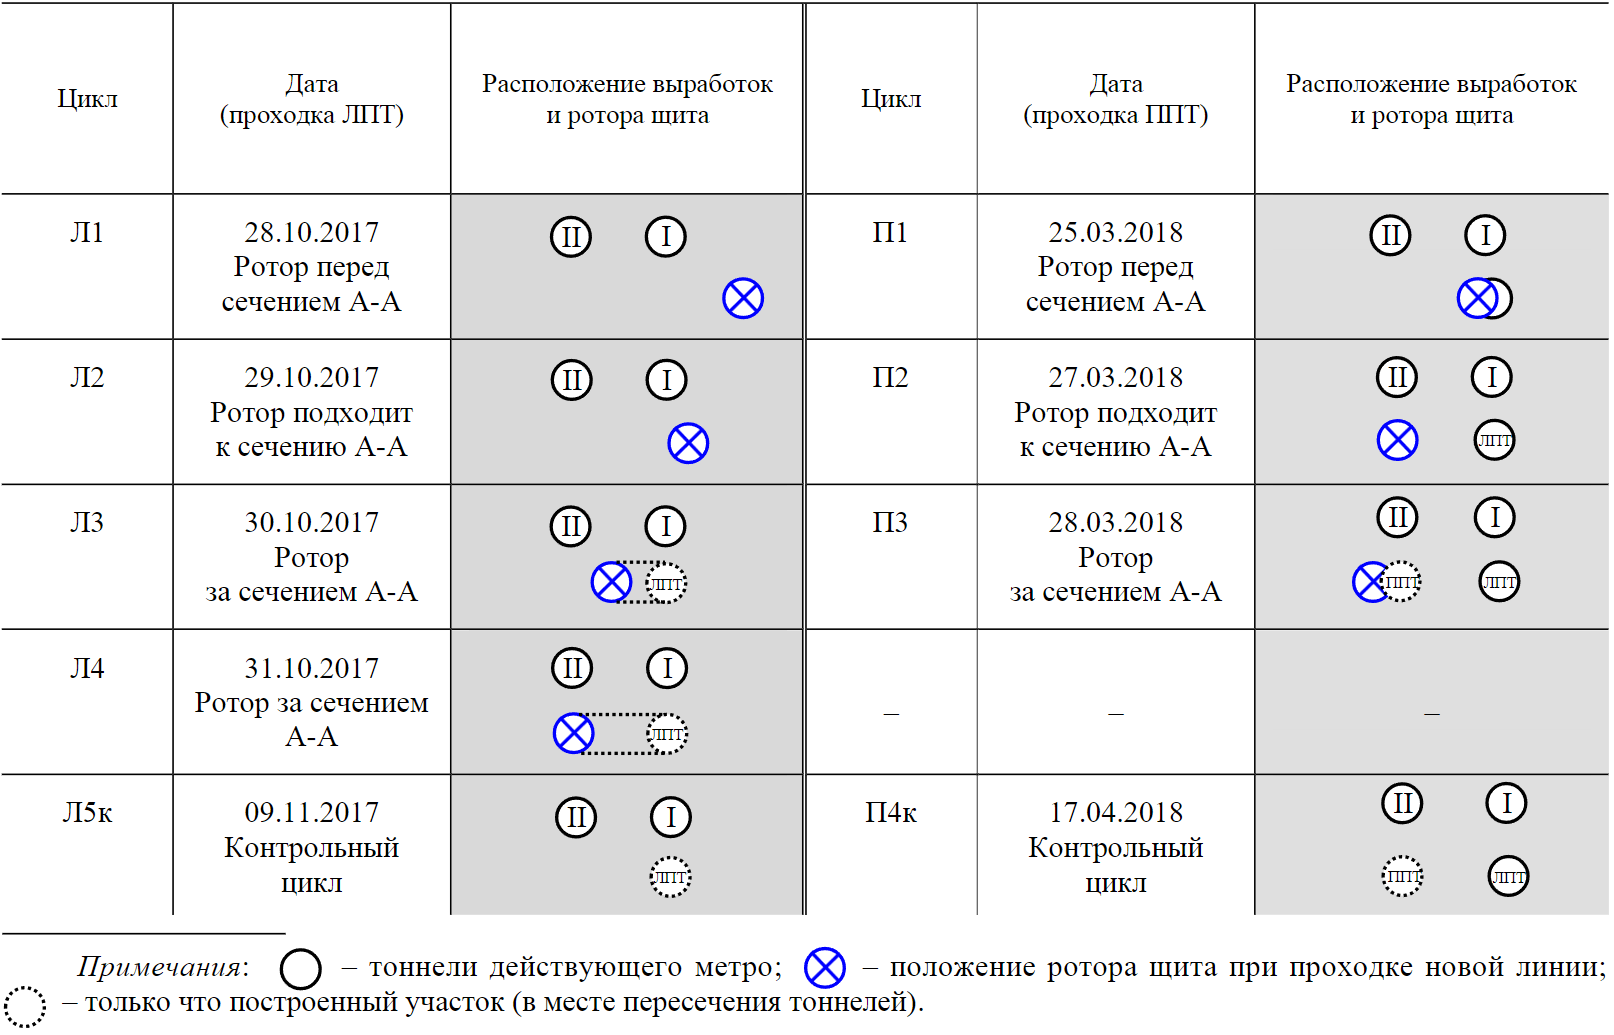
Research results. Based on the results of geophysical surveys and calculation of attributes, a map of contact properties was built. The E values were located on the tunnel sweep at the survey points. The E values were interpolated between the points. The most commonly used method was either Krige or Shepard. The number of the ring N was plotted on the maps along the X axis. The number of the point n was plotted along the Y axis. Figure 3 shows examples of such maps for cycles R3 and R4c. Both maps were taken on the first path. The threshold values of the attribute E were obtained from surveys in which the quality of the contact is known in advance. Exceeding the threshold E meant that there was bad contact behind the lining.
Numerical characteristics are desirable to use for comparative analysis of maps. The percentage of the map area corresponding to the bad contact K was selected as a similar characteristic. Figure 4 shows graphs of the change of factor K from cycle to cycle. An additional study was conducted since the parameter K was influenced by the chosen interpolator when processing the results. One of the maps with a high percentage of K (cycle R3, path map I) was calculated with six different interpolators. Analyzing the results, we can conclude that the values of K vary slightly. The variation factor for these data was 6.8 %.
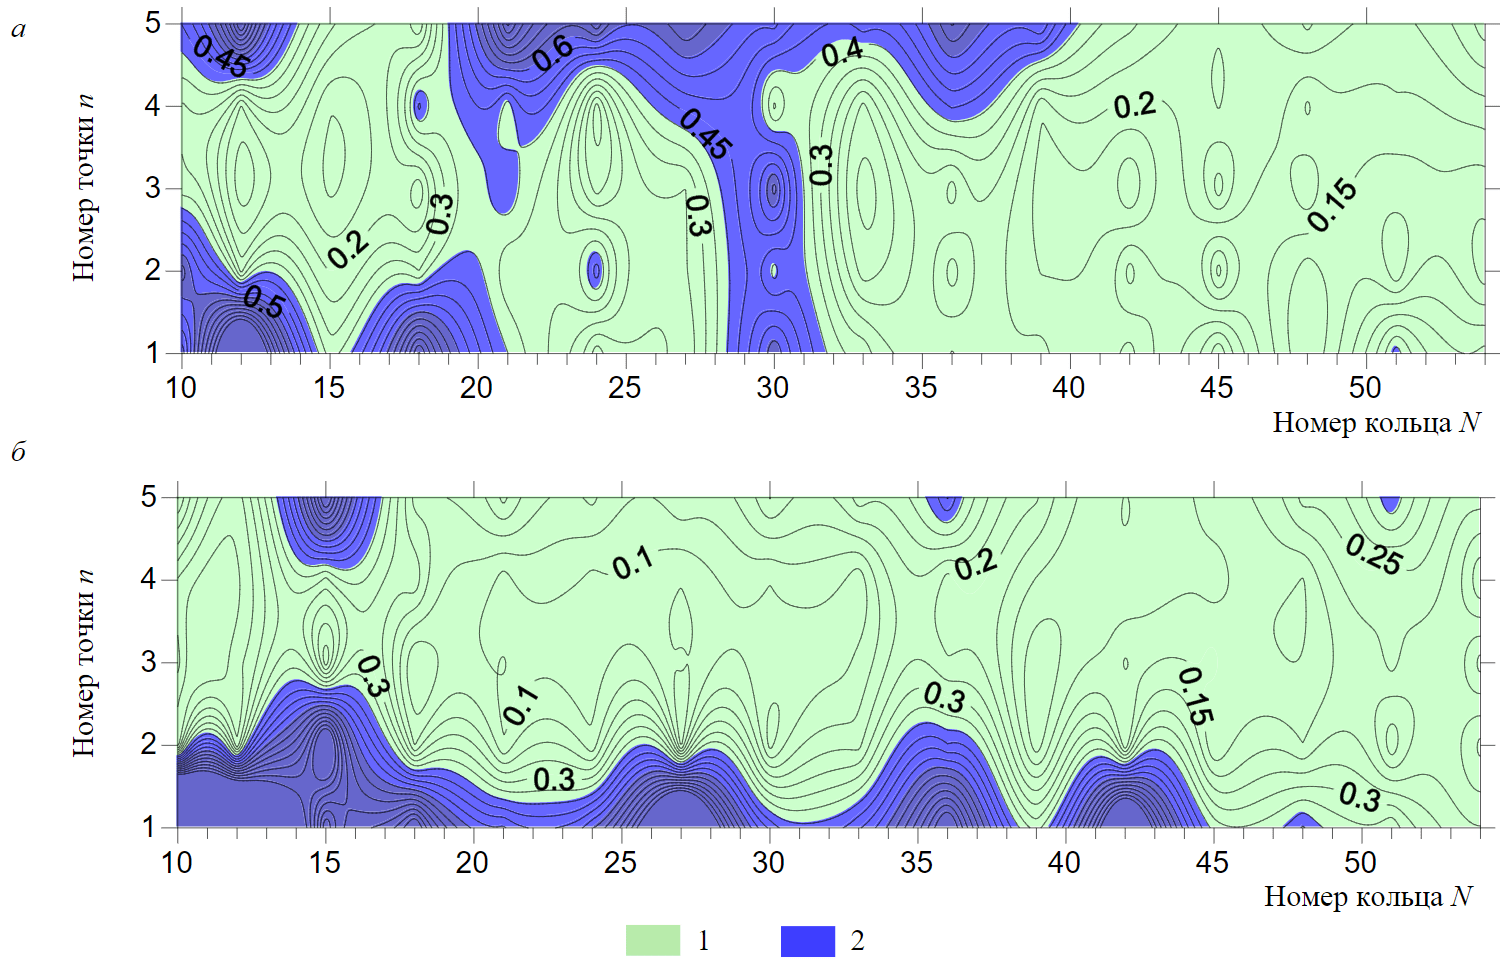
Fig.3. Examples of contact property maps for the path I: cycles R3 (a) and R4c (b) 1 – normal contact lining – ground massif; 2 – weakened contact lining – ground massif
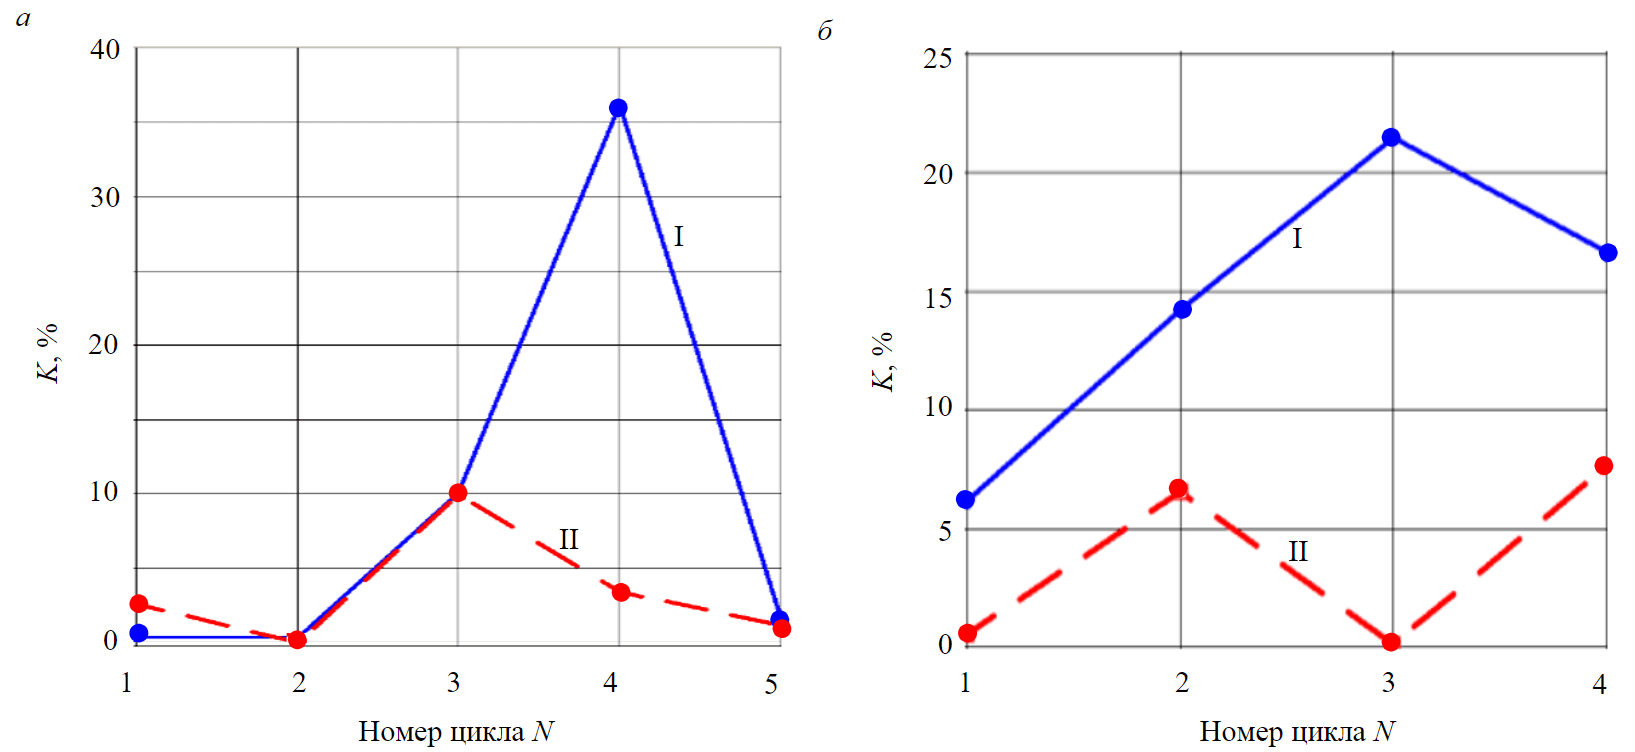
Fig.4. Graphs of the K-factor change versus the cycle number: L1 – L5c (a); R1 – R4c (b) I-II – path number
The modeling was carried out in the COMSOL Multiphysics environment for a deeper analysis of the results obtained. This modeling made it possible to explain some of the features observed on the contact properties maps and graphs K. Geophysical studies were carried out in the interval between the movements of metro trains. They did not respond to ground and the linings fluctuations caused by their movement. Thus, the problem was solved in a static formulation for the correct joint analysis of full-scale and model results.
The model was developed based on an example from the COMSOL Multiphysics model library (Stresses in the soil surrounding a traffic tunnel). It is based on the Drucker – Prager strength criterion. At the same time, it was taken into account that when calculating in a two – dimensional formulation of the problem, modeling was performed in a three-dimensional formulation corresponding to the Drucker – Prager criterion. Stresses and deformations were considered only in the corresponding two-dimensional section. The yield surface in this case was determined as follows:
where is the average stress; σe is the equivalent deviator stress; α and K are material constants; σi are principal stresses; sij are deviatoric stress components: ; ; ; ; ; .
The parameters of the Drucker – Prager criterion are calculated using the parameters of the Mohr – Coulomb criterion:
where c is adhesion, kPa; φ is the angle of internal friction, deg.
A two-dimensional model of the rock massif was used, which is a homogeneous layer with a thickness of 65 m (idealized soil massif), where the tunnels were located. They were modeled as an unfilled ring of concrete lining. The properties of the rock massif and the lining were set based on the results of engineering and geological surveys. The main values of the model physical properties (massif/lining) were as follows: angle of internal friction φ = 36°/–; adhesion c = 50/– kPa; specific gravity γ = 22/25 kN/m3; modulus of elasticity E = 50/20000 MPa; Poisson's ratio ν = 0.3/0.2.

Fig.5. The general scheme of the model for four tunnels with a finite element grid and the indication of boundary conditions in the global coordinate system of COMSOL Multiphysics
The initial stress field specified in the model used only the gravitational component, since the tectonic component is insignificant for the Moscow region. Boundary conditions were Free on the daylight surface (any displacements were possible), Roller on the remaining boundaries (displacements were possible along the boundary, and not possible perpendicular to the boundary). Figure 5 shows the general scheme of the model, indicating the boundary conditions in the COMSOL Multiphysics global coordinate system.
The simulation results are shown in Fig.6. Here, the isolines give the values of the equivalent deviatoric stress σe. Binary color scale denotes effective plastic deformations epl. There were plastic deformations in areas for which epl > 0. There are no plastic deformations where epl 0.
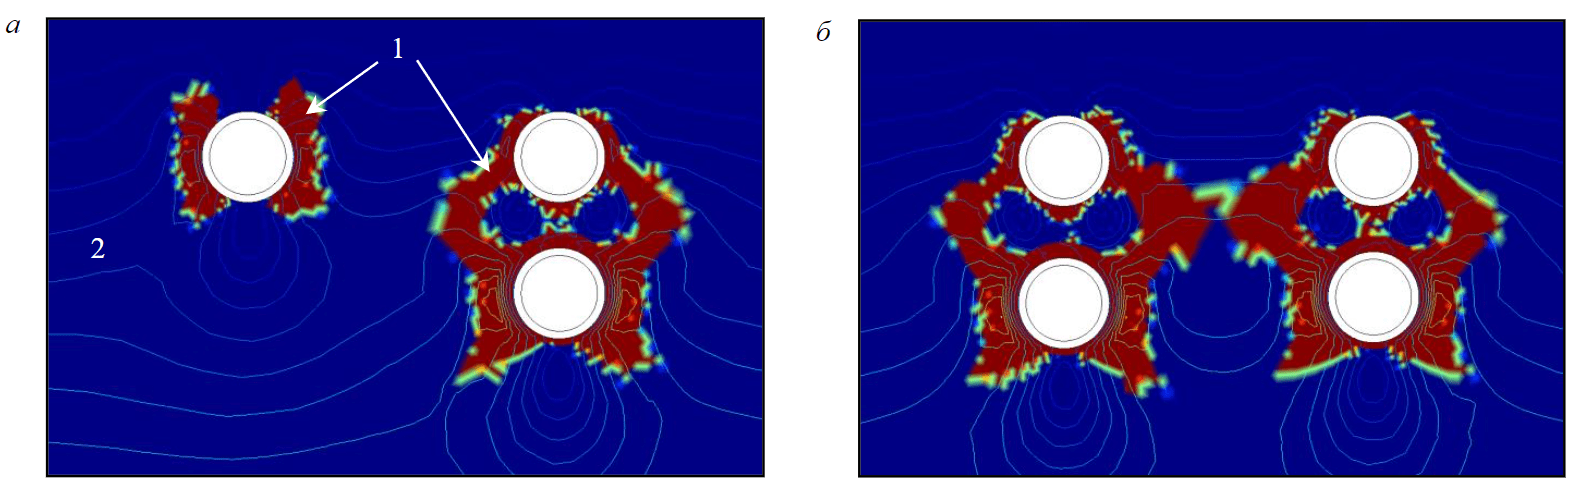
Fig.6. Simulation results in the form of values of equivalent deviatory stress σe (isolines)
and effective plastic deformations εpl (binary scale): stage after excavating of LATT (a) and RATT (b) 1 – presence of εpl; 2 – absence of εpl; white arrows – areas in which areas of plastic deformation developed
Several models differing in the number of tunnels were calculated. Variants with 1, 2, 3 and 4 tunnels were developed, which were located in accordance with the actual position of the workings. According to the simulation results, it can be noted that the lower right tunnel was located slightly higher, which corresponds to the real state of the tunnels. On the Fig.6, a you can see behavior of the soil massif around a separate tunnel (upper left) and two tunnels located one under the other (right tunnels). Figure 6, b shows a variant with all four tunnels.
An additional study was conducted with varying values of the physical parameters of the Pi model in order to assess how much the size and shape of the areas can change. Here the number i is the parameter number given in Table 2. This investigation was carried out on a model with one tunnel in the massif using the method of a one – factor experiment, when one factor was changed, and all the other factors were unchanged. Preliminary variation of the lining parameters showed that they practically do not affect the size and shape of plastic deformation areas.
Table 2
Sensitivity coefficients evaluating the effect of varying soil parameters on the size of areas of plastic deformation
|
i |
1 |
2 |
3 |
4 |
5 |
|
Pi |
ν |
φ |
c |
E |
γ |
|
Si |
–6.3 |
–2 |
–1.7 |
0.12 |
1.75 |
The variation of soil parameters was carried out at five levels within the possible maximum and minimum of their values. The following parameter ranges were used: ν = 0.29-0.33, φ = 30-46°, c = 35-55 kPa, E = 20-60 MPa, γ = 16-28 kN/m3.
During the study, it became clear that the change in the values of Pi mainly affects the size of the areas of plastic deformations. The areas can either press against the lining or move away from it. However, the shape and area of their fit to the lining change slightly. A methodology for assessing the sensitivity of the model to the influence of changes in parameter values has also been developed. The size of the area L is chosen as the criterion. Since the regions remained compact for all variants of parameter values, it was decided to use the maximum distance from the lining to the edge of the plastic deformation area as L.
Graphs of dependencies L(ν), L(φ), L(c), L(E), L(γ) were plotted. To minimize the influence of absolute values, the values of L and the parameters ν, φ, c, E, γ were normalized to their maxima. The resulting graphs in most cases showed either monotonous growth or monotonous decline. Since the graphs had mostly weak nonlinearity, it was decided to use their extreme values to assess sensitivity. Based on these assumptions, sensitivity coefficients are calculated for each Pi parameter:
where i was the parameter number; L(Pmax,i), L(Pmin,i) are the dimensions L of the area of plastic deformations at the maximum and minimum values of the i-th parameter; Pmax,i and Pmin,i are the maximum and minimum values of the ith parameter. Thus, Si estimates the increase in the size of the plastic deformation area L relative to the increase in the parameter value.
The obtained sensitivity coefficients were presented in Table 2. It can be noted that the Young's modulus had the least effect on the size of the areas, and the Poisson's ratio had the greatest effect. A negative Si value indicates that the increment of the parameter causes a decrease in the size of the area. A positive one causes its increase. Such coefficients can be used to assess how acceptable it is to transfer the simulation results to other construction sites, where other properties of the massif may differ.
Analyzing the simulation results, we note that the boring of three and four tunnels in the massif creates a complex stress-strain state. The location of plastic deformation zones around a separate mine well corresponds to the typical observed pattern obtained during a geophysical survey. For example, at points n = 1 and n = 5 cavities occur most often, n = 2 and n = 4 – less often, n = 3 – very rarely. Noting this feature it is possible to confirm the typical results of geophysical studies and to assume that the high energy of the response to the impact corresponds to the zones of plastic deformation behind the lining and is associated with the decompression of the soil in the area of contact between the lining and the soil. This fact can be detected during geophysical studies.
Areas of plastic deformation can close together and form a single system located between four tunnels (Fig.6, b). Obtaining such results made it possible to explain some features of the behavior of the decompression areas, the dimensions of which were estimated using the IR method.
Discussion of the results
The carried-out modeling, together with the interpretation of the results of field studies, allowed to confirm the results of geophysical studies and to obtain additional conclusions.
The most noticeable common features that can be seen from the obtained graphs of the coefficient K are that they contain pronounced peaks. With the development of the situation, the areas of poor soil-lining contact initially increased, and then decreased. In this case, the deformations were redistributed in the massif, and the cavities were closed.
In Fig.4, a the most pronounced peak detected during the LATT boring is on the fourth cycle of the survey along the I path. The fact that this peak was observed already after the shield passed under the survey site (on the third cycle, see Table 1) is easy to explain by the time it takes for plastic deformations to reach the zones of the massif located near the tunnel “path I”. Figure 6 shows that similar processes occur, and plastic deformation zones not only occur near new tunnels, but also reach old tunnels, and also change the shape of decompression zones near existing tunnels.
An interesting feature has the chart of the boring of the RATT (see Fig.4, b). The graph of path I shows a well-defined peak on the third cycle (see Fig.3, a). The peculiarity of this map is that areas of bad contact appear even at the point n = 3, where they are very rare. The area capturing the point n = 3 is located at the place where the shield passed under the tunnel of path I earlier during the boring of the LATT (see Fig.3, a at N = 30). In other words, the boring of a neighboring tunnel (RATT) affected the section already passed and aggravated the situation. The results of the simulation with four tunnels show how such a process could occur. Figure 6, b shows that areas of plastic deformations can occur in the space between the four tunnels. Thus, the boring of the RATT can worsen the situation near the place where the LATT was previously bored.
Unfortunately, both geophysical surveys on path II are heavily influenced by random factors. In both cases, on the first cycles, path II graphs behave similarly to path I graphs. However, these graphs show dips at the peaks where the massif is consolidating. Both cases can be explained by the fact that the moment of maximum decompaction simply did not fall into the planned measurement system limited by the technological features of the metro. This is especially evident in cycles 3 and 4 of the RATT. Cycle 3 corresponds to the moment when the shield has just moved away from the point of intersection with the tunnel “path II”. Most likely, plastic deformations did not have time to reach the massif near this tunnel. The fourth cycle is the control cycle and was performed later than the third cycle.
It is worth noting one more feature, which was explained by the joint interpretation of the modeling results and field measurements. The tunnel, which was not affected by the excavation of the underlying working, can be seen in Fig.6, a (top left tunnel). The situation changes when a tunneling is carried out under it (Fig.6, b). In this case, the zones of plastic deformations at the contact soil – lining move slightly upwards, to the point n = 3 (Fig.6, b). In these areas, the ratios between normal and tangential stresses, in accordance with the Mohr – Coulomb strength criterion, lead to the formation of plastic deformation areas that are shifted upwards. It is important to note that we are not talking about the absolute size of these areas, but about relative part of the soil – lining contact with plastic deformations.
Analyzing the maps of the contact properties, it can be noted that when excavating under the tunnel at its upper point (n = 3) the areas of decompression begin to be observed more often. As an example, we can consider the contact properties map in Fig.6, a, obtained immediately after excavating under the tunnel. Unlike the map of Fig.6, b, here several upper points at once indicate poor contact of the soil – lining.
Conclusion
During the excavation of two new tunnels under two existing tunnels, the studies involving the use of geophysical surveys in existing tunnels, as well as numerical modeling of the stress-strain state prediction of the tunnel – soil massif system were carried out. Based on the conducted research and joint interpretation of the results, it was possible to identify the following:
- There is a satisfactory convergence between the results of geophysical studies of the areas of decompression of the soil massif in the space behind the lining and numerical modeling of zones of plastic deformation.
- Numerical modeling has shown that plastic deformation zones are mainly formed along the lateral surfaces of the tunnel and should rarely be observed in the trough part and the upper point of the tunnel, which is confirmed by the results of geophysical observations. In a complex mining situation with four tunnels side by side in a massif, plastic deformation areas may appear not only next to the tunnels, but also between them.
- It can be noted that there is a delay between the moment of new tunnel excavation and the formation of poor soil – lining contact areas of the existing tunnel when performing instrumental measurements in both existing tunnels. After some time, the processes of formation of these areas can acquire a reverse character of development. At the same time, the size of areas of weakened contact soil – lining reduce.
- A complex stress-strain state can be observed during construction in difficult mining and technological conditions when excavating two tunnels under the already existing two tunnels. Plastic deformation zones may arise not at the point where the tunnel under construction passes the existing tunnel, but where the tunneling was carried out several months ago. At the same time, decompression areas are not yet observed at the moment of crossing the existing and under construction tunnels due to the delay effect.
- Under such excavation conditions, a situation may arise, observed both in geophysical and model studies, when the areas of poor contact will develop not to the sides from the intersection point of the existing and under construction tunnels, but to the upper point of the existing tunnel, forming a ring of decompacted soils around him.
References
- Protosenya A.G., Iovlev G.А. Prediction of spatial stress-strain behavior of physically nonlinear soil mass in tunnel face area. Mining Informational and Analytical Bulletin. 2020. N 5, p. 128-139 (in Russian). DOI: 10.25018/0236-1493-2020-5-0-128-139
- Karasev M.A. Prediction of surface settlements duo to construction of underground structures in geological condition of Saint Petersburg. Journal of Mining Institute. 2013. Vol. 204, p. 248-254 (in Russian).
- Karasev M.A., Belyakov N.A. Estimation of Surface Settlements Troughs Due to Subway Station Construction in Claystone. Biosciences biotechnology research Asia. 2015. Vol. 12. N 3, p. 2505-2516. DOI: 10.13005/bbra/1930
- Bilotta E., Paolillo A., Russo G., Aversa S. Displacements induced by tunnelling under a historical building. Tunnelling and Underground Space Technology. 2017. Vol. 61, p. 221-232. DOI: 10.1016/j.tust.2016.10.007
- Fei Peng, Shiju Ma. Analysis of experimental data on the effect of double-line parallel shield tunneling on the deformation of adjacent buildings. Alexandria Engineering Journal. 2021. Vol. 60. Iss. 4, p. 3957-3963. DOI: 10.1016/j.aej.2021.02.034
- Jianwen Liu, Chenghua Shi, Mingfeng Lei et al. A study on damage mechanism modelling of shield tunnel under unloading based on damage-plasticity model of concrete. Engineering Failure Analysis. 2021. Vol. 123. N 105261. DOI: 10.1016/j.engfailanal.2021.105261
- Chengyong Cao, Chenghua Shi, Mingfeng Lei et al. Deformation Characteristics and Countermeasures of shallow and Large-span Tunnel Under-crossing the Existing Highway in Soft Soil: a Case Study. KSCE Journal of Civil Engineering. 2018. Vol. 22. Iss. 8, p. 3170-3181. DOI: 10.1007/s12205-017-1586-6
- Junlong Yang, Chen Liu, Qiushi Chen, Xiongyao Xie. Performance of overlapped shield tunneling through an integrated physical model tests, numerical simulations and real-time field monitoring. Underground Space. 2017. Vol. 2. Iss. 1, p. 45-59. DOI: 10.1016/j.undsp.2017.04.002
- Qian Fang, Dingli Zhang, QianQian Li, Louis Ngai Yuen Wong. Effects of twin tunnels construction beneath existing shield-driven twin tunnels. Tunnelling and Underground Space Technology. 2015. Vol. 45, p. 128-137. DOI: 10.1016/j.tust.2014.10.001
- Do N.A., Dias D., Oreste P., Djeran-Maigre I. Three-dimensional numerical simulation of a mechanized twin tunnels in soft ground. Tunnelling and Underground Space Technology. 2014. Vol. 42, p. 40-51. DOI: 10.1016/j.tust.2014.02.001
- Chen R.P., Zhu J., Liu W., Tang X.W. Ground movement induced by parallel EPB tunnels in silty soils. Tunnelling and Underground Space Technology. 2011. Vol. 26. Iss. 1, p. 163-171. DOI: 10.1016/j.tust.2010.09.004
- Minglun Yin, Hua Jiang, Yusheng Jiang et al. Effect of the excavation clearance of an under-crossing shield tunnel on existing shield tunnels. Tunnelling and Underground Space Technology. 2018. Vol. 78, p. 245-258. DOI: 10.1016/j.tust.2018.04.034
- Xu Zhang, Chengping Zhang, Bo Min, Youjun Xu. Experimental study on the mechanical response and failure behavior of double-arch tunnels with cavities behind the liner. Geomechanics and Engineering. 2020. Vol. 20. N 5, p. 399-410. DOI: 10.12989/gae.2020.20.5.399
- Li X.G., Yuan D.J. Response of a double-decked metro tunnel to shield driving of twin closely under-crossing tunnels. Tunnelling and Underground Space Technology. 2012. Vol. 28, p. 18-30. DOI: 10.1016/j.tust.2011.08.005
- Esen Sze Y.S., Jim Yee T.C., Henry Kim I. et al. Tunnelling undercrossing existing live MRT tunnels. Tunnelling and Underground Space Technology. 2016. Vol. 57, p. 241-256. DOI: 10.1016/j.tust.2016.02.013
- Rongzhu Liang, Tangdai Xia, Yi Hong, Feng Yu. Effects of above-crossing tunnelling on the existing shield tunnels. Tunnelling and Underground Space Technology. 2016. Vol. 58, p. 159-176. DOI: 10.1016/j.tust.2016.05.002
- Hua Jiang, Jinguo Cheng, Jinxun Zhang et al. Principle and application of in-situ monitoring system for ground displacement induced by shield tunneling. Tunnelling and Underground Space Technology. 2021. Vol. 112. N 103905. DOI: 10.1016/j.tust.2021.103905
- Kannangara K.K.P.M., Zhi Ding, Wan-Huan Zhou. Surface settlements induced by twin tunneling in silty sand. Underground Space. Vol. 7. Iss. 1, p. 58-75. DOI: 10.1016/j.undsp.2021.05.002
- Zhang W.G., Li H.R., Wu C.Z. et al. Soft computing approach for prediction of surface settlement induced by earth pressure balance shield tunneling. Underground Space. 2021. Vol. 6. Iss. 4, p. 353-363. DOI: 10.1016/j.undsp.2019.12.003
- Sen Zhang, Wanyin Wu, Zhao Yang et al. MLLBC: A Machine Learning Toolbox for Modeling the Loss Rate of the Lining Bearing Capacity. IEEE Access. 2020. Vol. 8, p. 50256-50267. DOI: 10.1109/ACCESS.2020.2979833
- Zuliang Zhong, Chao Li, Xinrong Liu et al. Analysis of ground surface settlement induced by the construction of mechanized twin tunnels in soil-rock mass mixed ground. Tunnelling and Underground Space Technology. 2021. Vol. 110. N 103746. DOI: 10.1016/j.tust.2020.103746
- Ochmański M., Spacagna R.L., Modoni G. 3D numerical simulation of consolidation induced in soft ground by EPB technology and lining defects. Computers and Geotechnics. 2020. Vol. 128. N 103830. DOI: 10.1016/j.compgeo.2020.103830
- Meschke G. From advance exploration to real time steering of TBMs: A review on pertinent research in the Collaborative Research Center “Interaction Modeling in Mechanized Tunneling”. Underground Space. 2018. Vol. 3. Iss. 1, p. 1-20. DOI: 10.1016/j.undsp.2018.01.002
- Baogang Mu, Xiaokun Xie, Xing Li et al. Monitoring, modelling and prediction of segmental lining deformation and ground settlement of an EPB tunnel in different soils. Tunnelling and Underground Space Technology. 2021. Vol. 113. N 103870. DOI: 10.1016/j.tust.2021.103870
- Gang Zheng, Xinyu Yang, Haizuo Zhou et al. A simplified prediction method for evaluating tunnel displacement induced by laterally adjacent excavations. Computers and Geotechnics. 2018. Vol. 95, p. 119-128. DOI: 10.1016/j.compgeo.2017.10.006
- Baghban Golpasand M.R., Do N.A., Dias D. Impact of pre-existent Qanats on ground settlements due to mechanized tunneling. Transportation Geotechnics. 2019. Vol. 21. N 100262. DOI: 10.1016/j.trgeo.2019.100262
- Chakeri H., Ozcelik Y., Unver B. Effects of important factors on surface settlement prediction for metro tunnel excavated by EPB. Tunnelling and Underground Space Technology. 2013. Vol. 36, p. 14-23. DOI: 10.1016/j.tust.2013.02.002
- Astore D., Karr'eri D., Kiriotti E. et al. Mechanized tunnelling in urban areas. Design methodology and construction control. St. Petersburg: Izd-vo Politekhnicheskogo universiteta, 2013, p. 582 (in Russian).
- Jifei Wang, Hongwei Huang, Xiongyao Xie, Bobet A. Void-induced liner deformation and stress redistribution. Tunnelling and Underground Space Technology. 2014. Vol. 40, p. 263-276. DOI: 10.1016/j.tust.2013.10.008
- Leung C., Meguid M.A. An experimental study of the effect of local contact loss on the earth pressure distribution on existing tunnel linings. Tunnelling and Underground Space Technology. 2011. Vol. 26. Iss. 1, p. 139-145. DOI: 10.1016/j.tust.2010.08.003
- Huai-Na Wu, Shui-Long Shen, Ren-Peng Chen, Annan Zhou. Three-dimensional numerical modelling on localised leakage in segmental lining of shield tunnels. Computers and Geotechnics. 2020. Vol. 122. N 103549. DOI: 10.1016/j.compgeo.2020.103549
- Hai-xiang Tang, Shi-guo Long, Ting Li. Quantitative evaluation of tunnel lining voids by acoustic spectrum analysis. Construction and Building Materials. 2019. Vol. 228. N 116762. DOI: 10.1016/j.conbuildmat.2019.116762
- Azari H., Nazarian S., Yuan D. Assessing sensitivity of impact echo and ultrasonic surface waves methods for nondestructive evaluation of concrete structures. Construction and Building Materials. 2014. Vol. 71, p. 384-391. DOI: 10.1016/j.conbuildmat.2014.08.056
- Davis A.G., Lim M.K., Petersen C.G. Rapid and economical evaluation of concrete tunnel linings with impulse response and impulse radar non-destructive methods. NDT & E International. 2005. Vol. 38. Iss. 3, p. 181-186. DOI: 10.1016/j.ndteint.2004.03.011
- Kravitz B., Mooney M., Karlovsek J. et al. Void detection in two-component annulus grout behind a pre-cast segmental tunnel liner using Ground Penetrating Radar. Tunnelling and Underground Space Technology. 2019. Vol. 83, p. 381-392. DOI: 10.1016/j.tust.2018.09.032
- Nabatov V.V., Voznesensky A.S. Georadar detection of voids at the soil-lining interface in subway tunnels. Gornyi zhurnal. 2015. N 2, p. 15-20 (in Russian). DOI: 10.17580/gzh.2015.02.03
- Ki-Il Song, Gye-Chun Cho. Bonding state evaluation of tunnel shotcrete applied onto hard rocks using the impact-echo method. NDT & E International. 2009. Vol. 42. Iss. 6, p. 487-500. DOI: 10.1016/j.ndteint.2009.02.007
- Chaudhary M.T.A. Effectiveness of Impact Echo testing in detecting flaws in prestressed concrete slabs. Construction and Building Materials. 2013. Vol. 47, p. 753-759. DOI: 10.1016/j.conbuildmat.2013.05.021
- Guoze Lu, Wenke Zhao, Forte E. et al. Multi-frequency and multi-attribute GPR data fusion based on 2-D wavelet transform. Measurement. 2020. Vol. 166. N 108243. DOI: 10.1016/j.measurement.2020.108243
- Nikolenko P.V., Nabatov V.V. Interference protection in geoacoustic control of critical stresses in rocks. Gornyi zhurnal. 2015. N 9, p. 33-35 (in Russian). DOI: 10.17580/gzh.2015.09.06
- Shkuratnik V.L., Nikolenko P.V., Kormnov A.A. Ultrasonic correlation logging for roof rock structure diagnostics. Journal of Mining Science. 2015. Vol. 51. N 3, p. 456-461. DOI: 10.1134/S1062739115030059
- Fedorova L.L., Sokolov K.O., Savvin D.V., Kulyandin G.A. Analysis of variance amplitudes of signals for detecting structural permafrost heterogeneities by ground penetrating radar. Proceedings of the 15th International Conference on Ground Penetrating Radar, 30 June – 4 July 2014, Brussels, Belgium. IEEE, 2014, p. 301-305. DOI: 10.1109/ICGPR.2014.6970433
- Nabatov V.V. Detection of voids behind lining in metro tunnels by spectral attributes of Q-factor in the lining-soil system vibrations. Gornyi zhurnal. 2019. N 7, p. 67-70 (in Russian). DOI: 10.17580/gzh.2019.07.03